appwars Technologies logo

Power BI Training in Noida

Learn the tool that powers data-driven decisions at India’s biggest companies. Our Power BI training in Noida takes you from raw spreadsheets to interactive dashboards, gets you certified, and gets you job-ready with a Power BI course in Noida with placement support built around real business use cases not just theory.

Certification Partners

Official

Our Students Placed In These Companies

Power Bi Course Content

  • Introduction to Power BI - Need, Importance 
  • Power BI - Advantages and Scalable Options 
  • History - Power View, Power Query, Power Pivot 
  • Power BI Data Source Library and DW Files
  • Cloud Collaboration and Usage Scope
  • Business Analyst Tools, MS Cloud Tools
  • Power BI Installation and Cloud Account
  • Power BI Architecture and Data Access
  • On-premise Data Access and Microsoft On Drive
  • Power BI Desktop - Installation, Usage
  • Sample Reports and Visualization Controls
  • Power BI Cloud Account Configuration
  • Understanding Desktop & Mobile Editions
  • Power View and Power Map. Power BI Licenses 
  • Report Design with Database Tables
  • Understanding Power BI Report Designer
  • Report Canvas, Report Pages: Creation, Renames
  • Report Visuals, Fields and UI Options
  • Experimenting Visual Interactions, Advantages 
  • Reports with Multiple Pages and Advantages
  • Pages with Multiple Visualizations. Data Access
  • PUBLISH Options and Report Verification in Cloud 
  • "GET DATA" Options and Report Fields, Filters 
  • Report View Options: Full, Fit Page, Width Scale 
  • Report Design using Databases & Queries 
  • Query Settings and Data Preloads 
  • Navigation Options and Report Refresh 
  • Stacked bar chart, Stacked column chart 
  • Clustered bar chart, Clustered column chart
  • Adding Report Titles. Report Format Options
  • Focus Mode, Explore and Export Settings
  • Power BI Design: Canvas, Visualizations and Fields 
  • Import Data Options with Power BI Model, Advantages 
  • Direct Query Options and Real-time (LIVE) Data Access
  • Data Fields and Filters with Visualizations
  • Visualization Filters, Page Filters, Report Filters
  • Conditional Filters and Clearing. Testing Sets
  • Creating Customized Tables with Power BI Editor
  • General Properties, Sizing, Dimensions, and Positions
  • Alternate Text and Tiles. Header (Column, Row) Properties
  • Grid Properties (Vertical, Horizontal) and Styles
  • Table Styles & Alternate Row Colors - Static, Dynamic
  • Sparse, Flashy Rows, Condensed Table Reports. Focus Mode
  • Total Computations, Background. Borders Properties 
  • Column Headers, Column Formatting, Value Properties 
  • Conditional Formatting Options - Colour Scale
  • Visual-Level Filters and Format Options
  • Report Fields, Formats and Analytics 
  • Page-Level Filters and Column Formatting, Filters 
  • Background Properties, Borders and Lock Aspect 
  • CHART Report Types and Properties
  • STACKED BAR CHART, STACKED COLUMN CHART
  • CLUSTERED BAR CHART, CLUSTERED COLUMN CHART
  • 100% STACKED BAR CHART, 100% STACKED COLUMN CHART
  • LINE CHARTS, AREA CHARTS, STACKED AREA CHARTS
  • LINE AND STACKED ROW CHARTS
  • LINE AND STACKED COLUMN CHARTS
  • WATERFALL CHART, SCATTER CHART, PIE CHART
  • Field Properties: Axis, Legend, Value, Tooltip
  • Field Properties: Color Saturation, Filters Types
  • Formats: Legend, Axis, Data Labels, Plot Area
  • Data Labels: Visibility, Color and Display Units
  • Data Labels: Precision, Position, Text Options
  • Analytics: Constant Line, Position, Labels
  • Working with Waterfall Charts and Default Values
  • Modifying Legends and Visual Filters - Options
  • Map Reports: Working with Map Reports 
  • Javacript Object Notation - Usage with M Lang.
  • Applied Steps and Usage Options. Revert Options
  • Creating Query Groups and Query References. Usage
  • Query Rename, Load Enable and Data Refresh Options
  • Combine Queries - Merge Join and Anti-Join Options
  • Combine Queries - Union and Union All as New Dataset
  • M Language: Nested Join and Join Kind Functions
  • REPLACE, REMOVE ROWS, REMOVE COL, BLANK – M Lang
  • Column Splits and Filled Up / Filled Down Options
  • Query Hide and Change Type Options. Code Generation
  • Purpose of Data Analysis Expressions (DAX) 
  • Scope of Usage with DAX. Usability Options
  • DAX Context: Row Context and Filter Context
  • DAX Entities: Calculated Columns and Measures
  • DAX Data Types: Numeric, Boolean, Variant, Currency
  • Date time Data Type with DAX. Comparison with Excel
  • DAX Operators & Symbols. Usage. Operator Priority
  • Parenthesis, Comparison, Arithmetic, Text, Logic
  • DAX Functions and Types: Table Valued Functions
  • Filter, Aggregation and Time Intelligence Functions
  • Information Functions, Logical, Parent-Child Functions
  • Statistical and Text Functions. Formulas and Queries
  • Syntax Requirements with DAX. Differences with Excel
  • Naming Conventions and DAX Format Representation
  • Working with Special Characters in Table Names
  • Attribute / Column Scope with DAX - Examples
  • Measure / Column Scope with DAX - Examples
  • YTD, QTD, MTD Calculations with DAX 
  • DAX Calculations and Measures
  • Using TOPN, RANKX, RANK.EQ
  • Computations using STDEV & VAR
  • SAMPLE Function, COUNTALL, ISERROR
  • ISTEXT, DATEFORMAT, TIMEFORMAT
  • Time Intelligence Functions with DAX
  • Data Analysis Expressions and Functions
  • DATESYTD, DATESQTD, DATESMTD
  • ENDOFYEAR, ENDOFQUARTER, ENDOFMONTH
  • FIRSTDATE, LASTDATE, DATESBETWEEN
  • CLOSINGBALANCEYEAR, CLOSINGBALANCEQTR
  • SAMEPERIOD and PREVIOUSMONTH, QUARTER
  • KPIs with DAX. Vertipaq Queries in DAX
  • IF..ELSEIF.. Conditions with DAX
  • Slicing and Dicing Options with Columns, Measures
  • DAX for Query Extraction, Data Mashup Operations
  • Calculated Columns and Calculated Measures with DAX
  • Report Publish Options and Verifications 
  • Working with Power BI Cloud Interface & Options
  • Navigation Paths with "My Workspace" Screens
  • FILE, VIEW, EDIT REPORTS, ACCESS, DRILLDOWN 
  • Saving Reports into pdf, pptx, etc. Report Embed 
  • Report Rendering and EDIT, SAVE, Print Options 
  • Report PIN and individual Visual PIN Options 
  • Create and Use Dashboards. Menu Options 
  • Goto Dashboard and Goto LIVE Page Options 
  • Operations on Pinned Reports and Visuals 
  • TITLE, MEDIA, USAGE METRICS & FAVOURITES 
  • SUBSCRIPTION Options and Reports with Mobile View
  • Options with Report Page: Print and Subscribe
  • Report Actions: USAGE METRICS, ANALYZE IN EXCEL
  • Report Actions: RELATED ITEMS, RENAME, DELETЕ
  • Dashboard Actions: METRICS, RELATED ITEMS
  • Dashboard Actions: SETTINGS FOR Q & A, DELETE
  • PIN Actions: METRICS, SHARE, RELATED ITEMS
  • PIN Actions: SETTINGS FOR Q & A, DELETE
  • EDIT DASHBOARD (CLOUD), On-The-Fly Reports
  • Dataset Actions: CREATE REPORT, REFRESH
  • SCHEDULED REFRESH & RELATED ITEMS
  • Dashboard Integration with Apps in Power BI
  • Publish PowerBl Report Templates 
  • Import and Export Options with Power BI 
  • Dataset Navigations and Report Navigations 
  • Quick Navigation Options with "My Workspace" 
  • Dashboards, Workbooks, Reports, Datasets 
  • Working with MY WORK SPACE group 
  • Installing the Power BI Personal Gateway 
  • Automatic Refresh - Possible Issues 
  • Adding images to the dashboards 
  • Reading & Editing Power BI Views 
  • Power BI Templates (pbit)- Creation, Usage 
  • Managing report in Power BI Services 
  • PowerBI Gateway - Download and Installation
  • Personal and Enterprise Gateway Features
  • PowerBl Settings: Dataset - Gateway Integration
  • Configuring Dataset for Manual Refresh of Data
  • Configuring Automatic Refresh and Schedules
  • Workbooks and Alerts with Power BI
  • Data Navigation Paths and Data Splits 
  • Getting data from existing systems 
  • Data Refresh and LIVE Connections
  • pbit and pbix: differences. Usage Options
  • Quick Insights for Power BI Reports
  • Quick Insights for PowerBl Dashboards
  • Generating Insights with Cloud Datasets
  • Using relational databases on-premises
  • Using relational databases in the cloud
  • Consuming a service content pack
  • Creating a custom data set from a service
  • Creating a content pack for your organization
  • Consuming an organizational content pack
  • Updating an organizational content pack
  • Adding Tiles: Images, Videos, DataStream 
  • Creating New Reports from Cortina, Advantages 
  • SSRS Integration with Power BI 
  • SSRS Report Portal URL to Power BI Cloud 
  • Power BI KPI Reports Vs SSRS KPI Reports 
  • Converging and Working with Mobile Reports 
  • Report Builder Reports to Powert BI 
  • Generating QR Codes and Report Security
  • · Reporting JSON Files, Bulk Data Loads 
  • Creating high-density Reports in Power BI 
  • OLAP Data Sources in Power BI 
  • Using MDX Queries with PowerBI Queries
  • MDX SELECT and Perspective Access
  • KPIs and MDX Expressions with Power BI
  • MDX Queries and Filters with Power BI 
  • Linked Servers and T-SQL SPROCs with MDX 
  • YTD, PARALLELPERIOD, SCOPE, ALLMEMBERS 
  • WHERE, EXCEPT, RANGE, NONEMPTY 
  • CURRENT & EMPTY, AND / OR, LEFT/RIGHT 
  • Imlementing Row Level Security (RLS)
  • Security Roles and Role Members. Tests
  • Using R for Power BI, Streaming Datasets
  • Azure Connections with PowerBI Desktop
  • PowerBl Reports using SQL Azure DBs
  • Intractive Sales Dashboard 
  • Real-Time Financial Dashboard
  • Real-Time Pizza Delivery Tracking
  • HR Analytics
  • Hierarchies and Drilldown Options 
  • Hierarchy Levels and Drill Modes - Usage
  • Drill-thru Options with Tree Map and Pie Chart
  • Higher Levels and Next Level Navigation Options
  • Aggregates with Bottom/Up Navigations. Rules
  • Multi Field Aggregations and Hierarchies in Power BI
  • DRILLDOWN, SHOWNEXTLEVEL, EXPANDTONEXTLEVEL
  • SEE DATA and SEE RECORDS Options. Differences
  • Toggle Options with Tabular Data. Filters
  • Drilldown Buttons and Mouse Hover Options @ Visuals
  • Dependant Aggregations, Independent Aggregations
  • Automated Records Selection with Tabular Data
  • Report Parameters: Creation and Data Type
  • Available Values and Default values. Member Values
  • Parameters for Column Data and Table / Query Filters
  • Parameters Creation - Query Mode, UI Option
  • Linking Parameters to Query Columns - Options
  • Edit Query Options and Parameter Manage Entries
  • Connection Parameters and Dynamic Data Sources
  • Synonyms - Creation and Usage Options
  • Understanding Power Query Editor - Options 
  • wer BI Interface and Query / Dataset Edits
  • Working with Empty Tables and Load/ Edits
  • Empty Table Names and Header Row Promotions
  • Undo Headers Options. Blank Columns Detection
  • Data Imports and Query Marking in Query Editor
  • JSON Files & Binary Formats with Power Query
  • MSME, Govt of India Approved Company 
  • M.C.A. Govt. of India Registered Company 
  • ISO Certified Company 
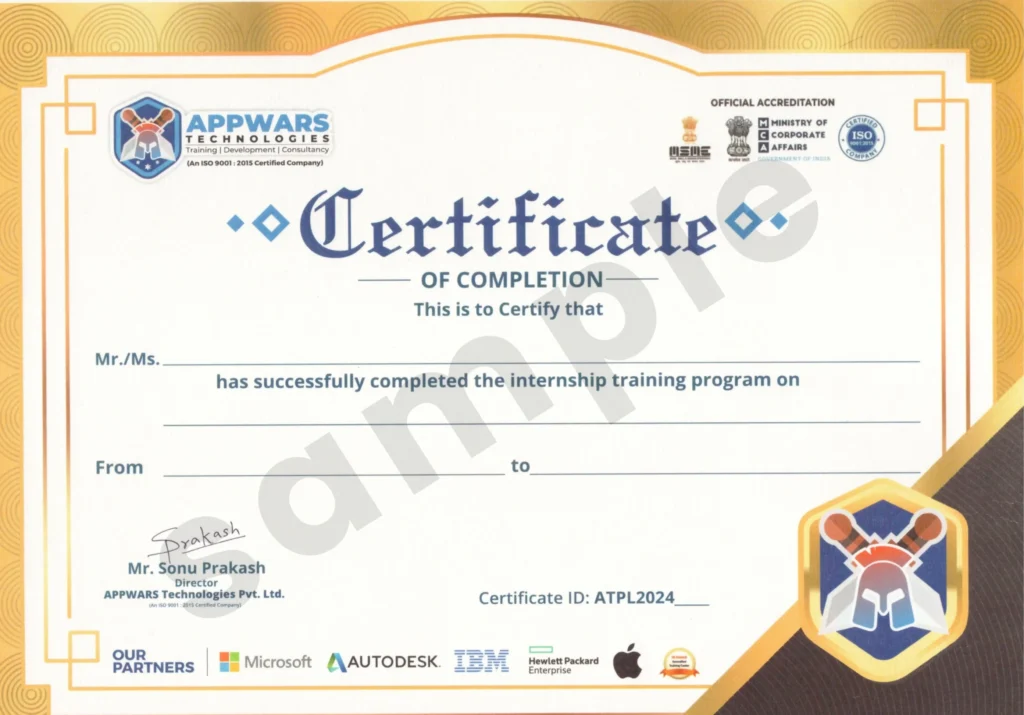
  • Internship Certificate 
  • Project Letter from IT Company (Tanvika Software) 
  • 15 students per batch 
  • Live Project work 
  • 100% Placement Assistance
  • Soft Skills
  • Interview Preparation
  • Mock Interviews
  • CV Building & ATS Score
  • Live Online, Offline & Hybrid Mode of Training
  • Recordings of Classes provided
  • LinkedIn Sessions 
  • Haker Rank Sessions
  • GitHub Sessions
  • IBM Vouchers & e-courseware available
Enquiry Now

    Our Placed Students

    placed students

    45+ Power BI skills Covered

    • Power BI Fundamentals
    • Power BI Desktop
    • Power BI Service
    • Data Import
    • Data Transformation
    • Data Cleaning
    • Power Query
    • Power Query M Language
    • Data Modeling
    • Star Schema
    • Relationships
    • Calculated Columns
    • Measures
    • DAX
    • DAX Functions
    • Time Intelligence
    • Data Visualization
    • Interactive Dashboards
    • Report Development
    • KPI Dashboards
    • Charts and Graphs
    • Slicers and Filters
    • Drill-Down
    • Drill-Through
    • Bookmarks
    • Tooltips
    • Conditional Formatting
    • Custom Visuals
    • Data Analysis
    • Business Intelligence
    • Excel Integration
    • SQL Server Integration
    • Database Connectivity
    • API Data Integration
    • Data Refresh
    • Scheduled Refresh
    • Power BI Gateway
    • Row-Level Security (RLS)
    • Workspace Management
    • Dashboard Sharing
    • Power BI Deployment
    • Performance Optimization
    • Report Optimization
    • Data Storytelling
    • Business Reporting
    • Power BI Report Server
    • Power BI Embedded
    • Microsoft Fabric

    Our Power BI Course Features

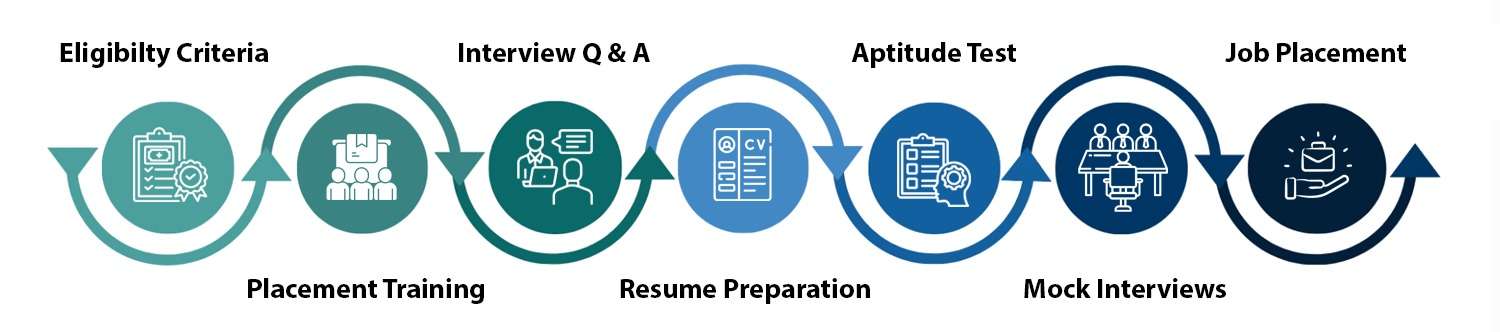
    Our Process

    our process

    Best Power BI Training Institute in Noida

    Business intelligence has become the backbone of decision-making at every company that runs on data — and Power BI is the tool most Indian enterprises have standardized on for reporting, analytics, and dashboarding. That’s why our Power BI training institute in Noida is designed entirely around one goal: turning learners into analysts who can walk into a BI or data role on day one.

    As a Power BI training institute in Noida with a decade of placement-focused training behind it, we run this program for two kinds of learners: freshers who want a functional analytics career without a computer science background, and working professionals in finance, HR, or supply chain who want to add a high-demand skill to their resume, so you leave knowing how a real dashboard, a sales report, or a management MIS actually gets built not a generic tutorial.

    This is not a generic course. This is a genuine Power BI certification course in Noida that maps directly to the modules companies actually hire for: data modelling, DAX, Power Query, and dashboard design.

    Choosing the right Power BI training institute in Noida matters more than most people realize, because the difference between a course that gets you placed and one that doesn’t usually comes down to three things: who is teaching you, whether the content matches what companies actually use, and whether there’s real support after the certificate is printed. Our program is built by trainers who have shipped Power BI dashboards inside real organizations, not by instructors reading off a fixed slide deck. Every module is updated as Microsoft updates Power BI itself, so you’re never learning a version of the tool that companies stopped using two years ago.


    A certificate alone doesn’t get you hired interview readiness does. Our Power BI Course in Noida with Placement includes structured resume building around your project work, mock interviews conducted by people who’ve actually sat on a hiring panel, and direct referrals into our network of hiring partners. Placement support doesn’t end the day your batch finishes; it continues until you’re placed.

    There’s a reason our power bi classroom training in Noida consistently outperforms self-paced online courses for job outcomes: live correction. When you build a dashboard in a recorded video, nobody tells you the moment your data model is wrong. In a classroom, a mentor catches it before the mistake becomes a habit. You also get the accountability of a fixed schedule, peer learning from classmates solving the same assignments, and a structured curriculum instead of a scattered playlist of tutorials.

    Power BI adoption has grown across nearly every industry in India banking, retail, healthcare, manufacturing, and IT services all run some part of their reporting on it. Companies need people who can turn raw transactional data into dashboards leadership can actually act on, and that demand has made Power BI one of the most searched-for skills on job portals for data and business analyst roles. Professionals who pair Power BI with basic SQL and Excel consistently see faster hiring timelines than those with Power BI alone, which is why our curriculum layers in both.

    • Business Intelligence (BI) Analyst
    • Power BI Developer
    • Data Analyst
    • MIS Executive / MIS Analyst
    • Reporting Analyst
    • Business Analyst
    • Data Visualization Specialist

    Our Power BI course in Noida isn’t a single fixed track you can go deeper into the specialization that matches your career goal:

    • Power BI for Finance – budgeting dashboards, variance reports, financial KPIs
    • Power BI for HR Analytics – attrition dashboards, headcount and hiring funnels
    • Power BI for Supply Chain – inventory tracking, demand forecasting visuals
    • Power BI + SQL Integration – connecting live databases instead of static files
    • Power BI + Excel for MIS Roles – the most in-demand combination for entry-level analyst hiring


    • Live, instructor-led power bi classes in Noida never pre-recorded
    • Curriculum built around real dashboards, not toy datasets
    • Certification recognized by employers and backed by Microsoft-aligned learning content
    • Placement support that continues after the course ends
    • A power bi coaching centre in Noida run by professionals who’ve actually worked on enterprise BI projects
    1. Book a free demo class to see how a live session runs
    2. Speak with our academic counsellor about your background and goals
    3. Choose your batch – weekday, weekend, or fast-track
    4. Complete registration and receive your course access
    5. Begin live classes with mentor support from day one

    Placement support isn’t a one-time resume review. It includes iterative mock interviews, technical round preparation specific to BI and analyst roles, and warm introductions to our hiring partner network. We keep working with you until you’re placed, not just until your last class.

    Most learners complete the full Power BI certification training in Noida program in 6 to 10 weeks, depending on whether they choose a weekday or weekend batch, with additional time available for the live capstone project.
    • Freshers and recent graduates from any stream, including non-technical backgrounds
    • Excel users looking to move into a formal analytics role
    • Finance, HR, supply chain, and operations professionals who want to add a high-demand skill
    • Anyone preparing for a Power BI Course in Noida with Placement who wants a structured, mentor-led path instead of scattered self-study

    Power BI course fees

    New Batch Starting
    1.5 Months Course Fees
    ₹14,440/-
    ₹11,800/-
    Flat ₹2,640 OFF
    • 15 Students Per Batch
    • Live offline & online Classes from Industry Expert
    • Hands-on curriculum with Real-Life Projects

    Got more questions?

    Talk to our team directly

    Contact us and our academic counsellor will get in touch with you shortly

    Student Testimonials

    Frequently Asked Questions

    What is the difference between Power BI training and a general data analytics course?

    A general analytics course covers multiple tools at a surface level. This Power BI training in Noida is focused entirely on one platform Power Query, data modelling, DAX, and dashboarding in the depth companies actually test for in interviews.

    Is this Power BI course in Noida suitable for non-technical graduates?

    Yes. Most learners who enroll come from commerce, arts, or management backgrounds. The course is built around Excel-level starting knowledge, not programming experience.

    Do I need to know SQL before joining?

    No prior SQL knowledge is required. Basic SQL concepts needed for Power BI integration are covered within the course itself.

    Is this a Power BI certification course in Noida or just a training program?

    Both. You receive a course-completion certificate recognized by our placement partners, along with hands-on project work you can show in interviews.

    Does Appwars Technologies provide placement support after Power BI training?

    Yes. Placement support includes resume building, mock interviews, and introductions to hiring partners, and continues until you're placed not just until the batch ends.

    How is this different from other power bi coaching centre in Noida options?

    The combination of live classroom training, real project work, and continued placement support after the course ends is what distinguishes this program from purely online or self-paced alternatives.
    5/5 - (43 votes)
    popup-form-image


      Get Free Career Counseling

      Talk to our experts and choose the right course and career path for your future.