
Turn raw data into powerful business insights with Tableau Training in Noida at AppWars Technologies. Our Tableau course in Noida offers hands-on training in Tableau Desktop, Tableau Prep, calculated fields, LOD expressions, and real-world projects.
Designed for freshers, professionals, and aspiring data analysts, the course includes practical learning, certification, and placement assistance to help you become job-ready.











What is Tableau and its Importance in Data Visualization?
· Tableau Installation Guide
· Tableau Drivers – Download and Connect
· Tableau – Data Terminology
· Power BI vs Tableau – Top 5 Key Differences That You Should Know
Tableau – Navigation
Start Page in Tableau
Tableau – Design Flow
Tableau – File System
Tableau – Data Types
How to change Data type in Tableau?
Show Me in Tableau
Tableau – Connect to a data source
· Import Excel file in Tableau
· Data Cleaning in Tableau
· Tableau – Join databases
· Joining data files with inconsistent labels
· Replacing Data source
· Tableau – Split the text to columns
· Tableau – Displaying data in Worksheet
· Tableau – Adding, Renaming and duplicating worksheets
· Create Visualization
· Change the order in visualization
· Change the summary
· Tableau – Operators
· IF Function in Tableau
· Aggregate Functions in Tableau
· Create Calculated Field in Tableau
· Logical Functions in Tableau
· Case Function in Tableau
· Highlight Tables in Tableau
· Quick Table Calculation in Tableau
· LOD Calculation
· Filtering in Visualization in Tableau
· Quick Filter in Tableau
· Context Filter in Tableau
· Conditional Filter in Tableau
· Slicing Filter in Tableau
· Grouping in Visualization in Tableau
· Hierarchy in Tableau
· Set in Tableau
· Combined Set in Tableau
· Parameters in Tableau
· Tableau Bins
· Manual Sorting of Visualization in Tableau
· Sorting by Data Source order in Visualization in Tableau
· Sorting by field in Visualization in Tableau
· Line graph in Tableau
· Dual Lines Chart in Tableau
· Bar Chart in Tableau
· Side-by-Side Bars in Tableau
· Stacked Bars in Tableau
· Histogram in Tableau
· Cumulative Histogram in Tableau
· Scatter plot in Tableau
· Bubble Chart in Tableau
· Pie chart in tableau
· Crosstab in tableau
· Total in a crosstab by column in Tableau
· Box Plot in Tableau
· Bullet Graph in Tableau
· Area Chart in Tableau
· Heat Map in Tableau
· Basic Map in Tableau
· Geographical plot in Tableau
· Lollipop Chart in Tableau
· Circle views in Tableau
· Dual Combination Chart in Tableau
· Treemap in Tableau
· Funnel Chart in Tableau
· Traditional Funnel Chart in Tableau
· Waterfall Chart in Tableau
· Gantt Chart in Tableau
· Create a Dashboard in Tableau
· Text Object on Dashboard in Tableau
· Image Object on Dashboard in Tableau
· Tableau – Objects on Dashboard
· Tableau – Filters in Dashboard
· Tableau – Device Preview
· Format Dashboard Layout in Tableau
· Story Creation in Tableau
● High-Level overview of Data Science / Machine Learning project management methodology
● Random Variable and its definition
● Probability and Probability Distribution
● Balanced vs Imbalanced datasets
● Sampling Funnel, its application and its components
● Measure of central tendency
● Measure of Dispersion
● Expected value of probability distribution
● Measure of Skewness
● Measure of Kurtosis
● Various graphical techniques to understand data
● Installation of Python IDE
● Anaconda and Spyder
● Working with Python with some basic commands
● Normal Distribution
● Standard Normal Distribution / Z distribution
● Z scores and Z table
● QQ Plot / Quantile-Quantile plot
● Sampling Variation
● Central Limit Theorem
● Sample size calculator
● T-distribution / Student’s-t distribution
● Confidence interval
· Forecast in Tableau
· Reference line in Tableau
· Reference Band in Tableau
· Reference Distribution Band in Tableau
· Trend Lines in Tableau
· Tableau – Building up a storyline
· Word Cloud in Tableau
What is Tableau and its Importance in Data Visualization?
· Tableau Installation Guide
· Tableau Drivers – Download and Connect
· Tableau – Data Terminology
· Power BI vs Tableau – Top 5 Key Differences That You Should Know
Tableau – Navigation
Start Page in Tableau
Tableau – Design Flow
Tableau – File System
Tableau – Data Types
How to change Data type in Tableau?
Show Me in Tableau
Tableau – Connect to a data source
· Import Excel file in Tableau
· Data Cleaning in Tableau
· Tableau – Join databases
· Joining data files with inconsistent labels
· Replacing Data source
· Tableau – Split the text to columns
· Tableau – Displaying data in Worksheet
· Tableau – Adding, Renaming and duplicating worksheets
· Create Visualization
· Change the order in visualization
· Change the summary
· Tableau – Operators
· IF Function in Tableau
· Aggregate Functions in Tableau
· Create Calculated Field in Tableau
· Logical Functions in Tableau
· Case Function in Tableau
· Highlight Tables in Tableau
· Quick Table Calculation in Tableau
· LOD Calculation
· Filtering in Visualization in Tableau
· Quick Filter in Tableau
· Context Filter in Tableau
· Conditional Filter in Tableau
· Slicing Filter in Tableau
· Grouping in Visualization in Tableau
· Hierarchy in Tableau
· Set in Tableau
· Combined Set in Tableau
· Parameters in Tableau
· Tableau Bins
· Manual Sorting of Visualization in Tableau
· Sorting by Data Source order in Visualization in Tableau
· Sorting by field in Visualization in Tableau
· Line graph in Tableau
· Dual Lines Chart in Tableau
· Bar Chart in Tableau
· Side-by-Side Bars in Tableau
· Stacked Bars in Tableau
· Histogram in Tableau
· Cumulative Histogram in Tableau
· Scatter plot in Tableau
· Bubble Chart in Tableau
· Pie chart in tableau
· Crosstab in tableau
· Total in a crosstab by column in Tableau
· Box Plot in Tableau
· Bullet Graph in Tableau
· Area Chart in Tableau
· Heat Map in Tableau
· Basic Map in Tableau
· Geographical plot in Tableau
· Lollipop Chart in Tableau
· Circle views in Tableau
· Dual Combination Chart in Tableau
· Treemap in Tableau
· Funnel Chart in Tableau
· Traditional Funnel Chart in Tableau
· Waterfall Chart in Tableau
· Gantt Chart in Tableau
· Create a Dashboard in Tableau
· Text Object on Dashboard in Tableau
· Image Object on Dashboard in Tableau
· Tableau – Objects on Dashboard
· Tableau – Filters in Dashboard
· Tableau – Device Preview
· Format Dashboard Layout in Tableau
· Story Creation in Tableau
● High-Level overview of Data Science / Machine Learning project management methodology
● Random Variable and its definition
● Probability and Probability Distribution
● Balanced vs Imbalanced datasets
● Sampling Funnel, its application and its components
● Measure of central tendency
● Measure of Dispersion
● Expected value of probability distribution
● Measure of Skewness
● Measure of Kurtosis
● Various graphical techniques to understand data
● Installation of Python IDE
● Anaconda and Spyder
● Working with Python with some basic commands
● Normal Distribution
● Standard Normal Distribution / Z distribution
● Z scores and Z table
● QQ Plot / Quantile-Quantile plot
● Sampling Variation
● Central Limit Theorem
● Sample size calculator
● T-distribution / Student’s-t distribution
● Confidence interval
· Forecast in Tableau
· Reference line in Tableau
· Reference Band in Tableau
· Reference Distribution Band in Tableau
· Trend Lines in Tableau
· Tableau – Building up a storyline
· Word Cloud in Tableau
Enterprise resource planning is the software backbone that large companies use to run finance, HR, sales, and supply chain from one connected system, and SAP is the platform most Indian enterprises build that backbone on. That is why Appwars Technologies designed its ERP training in Noida entirely around SAP, rather than teaching ERP theory that never shows up in a real job description.
As an ERP institute in Noida with over a decade of placement-focused training behind it, we run this SAP ERP course for two kinds of learners: freshers who want a functional consulting career without a computer science background, and working professionals in finance, HR, or supply chain who want to move into an SAP-enabled role. Every batch is trained on live SAP systems, not slides, so you leave knowing how a materials request, a sales order, or a payroll run actually moves through the software.
This is not a generic ERP course. It is a SAP ERP training in Noida that maps directly to the module specializations companies hire for: MM, SD, FICO, PP, HANA, Basis, and HR.
Appwars Technologies built its reputation on placement-focused training, and the SAP ERP course is run with that outcome first. A few reasons students pick us over other institutes offering ERP training in Noida:
We are working continuously to make our placements more effective, and course fees are structured to stay reasonable without cutting into training quality or the number of hours you spend inside a live SAP system.
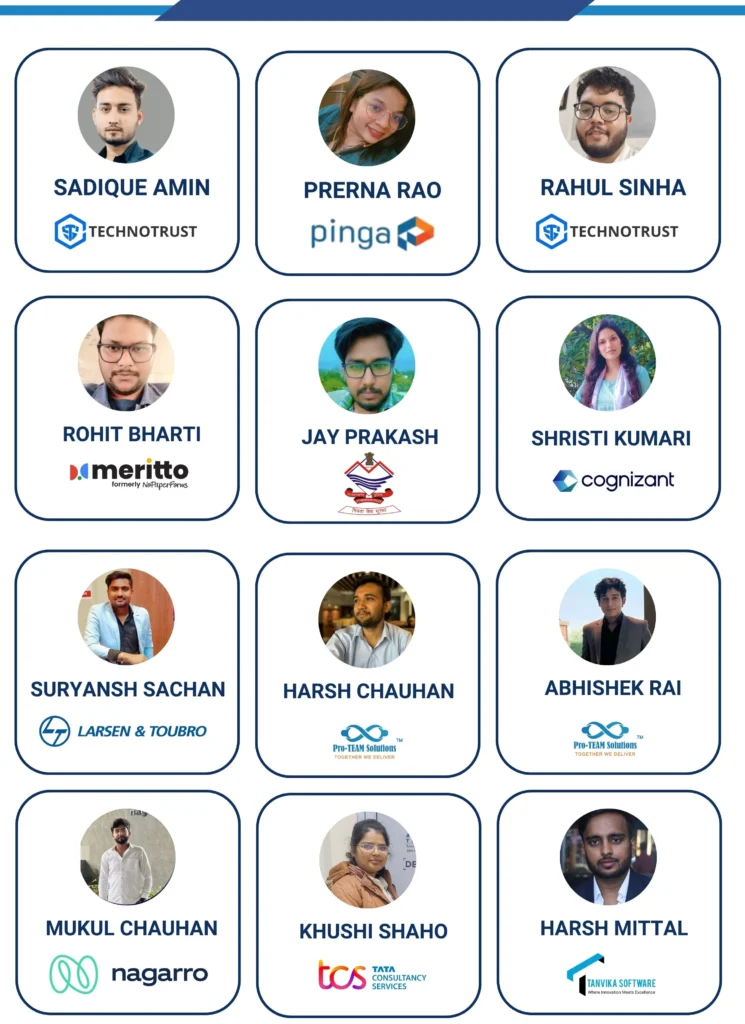
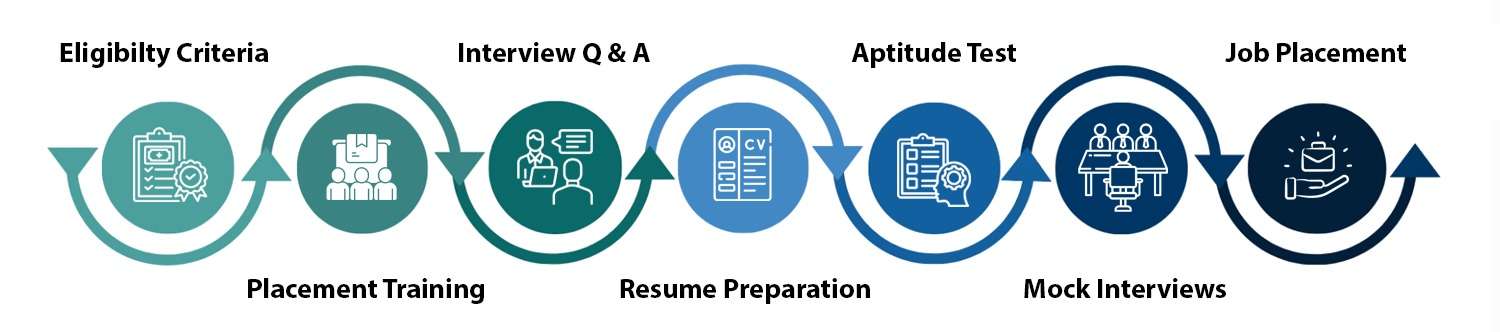
Our track record isn’t built on marketing claims. It comes from repeated placements across 40-plus batches and a growing base of hiring partners who return to us specifically for SAP-trained candidates. As part of the ERP training and placement program, you get resume reviews tailored to SAP job postings, interview preparation with real question banks from past placement drives, and direct introductions to companies hiring for MM, SD, FICO, and HANA roles.
A career built on SAP ERP skills tends to compound in value over time. Consulting firms rarely release a functional consultant into solo client work without two or three years of hands-on module experience, and that scarcity is exactly why demand for SAP-trained talent stays high across Noida, Gurugram, and the wider Delhi NCR IT corridor.
Every large enterprise, from manufacturing to retail to pharma, runs some flavor of SAP behind the scenes, which means the skill set travels across industries rather than locking you into one sector. A fresher who completes SAP ERP training in Noida with a solid grip on one or two modules typically starts as a support or associate consultant, then moves toward functional or technical specialist roles as project experience builds.
Once you complete the foundation course, you can go deep into the module that matches your career direction. Each of the following runs as a dedicated specialization under our SAP ERP course in Noida:
SAP ABAP is covered within the core program for students who want development exposure alongside a functional module, and a dedicated ABAP page is in progress.
1. Fill the application form Share your basic details and course interest so our counselling team can prepare a session tailored to your background.
2. Get personalized counselling Talk through your career goals, current experience, and which SAP module fits your direction with one of our academic counsellors.
3. Join the program Get trained by industry experts on a curriculum customized to your learning pace and career target.
Appwars Technologies stays involved after your last class. Placement support includes resume formatting aligned to how recruiters screen SAP profiles, structured mock interviews with feedback, and direct connections to our hiring partners actively recruiting for functional and technical SAP openings across Noida and Delhi NCR.
Batches run in both regular (weekday) and weekend formats to fit working professionals and full-time students differently. Exact duration depends on which SAP module track you choose. Check current batch dates and timing here: upcoming batch schedule.
Got more questions?
Contact us and our academic counsellor will get in touch with you shortly
EXCELLENT Based on 1358 reviews
 Posted on Google
 Anshika Panday
Trustindex verifies that the original source of the review is Google.
Excellent themes and communicationPosted on Google Kaif AhmadMR.PRIYANSHU PAL Sir is one of best IT professionals He is very motivational person and always encourages students to do better .I would give him 5 start ⭐ ✨Posted on Google
 Sanjeev KumarGreat communication and excellentPosted on Google
 VisheshPriyanshu pal he is a best IT member He is a best motivational person I gave him 5 star rating A special thanks to Priyanshu Pal Sir for his outstanding teaching. His teaching style is clear, engaging, and beginner-friendly. He explains every concept with real-life examples, making even difficult topics easy to understand. He is always patient, supportive, and encourages students to ask questions. I highly recommend this course to anyone who wants to start or build a career in Data Analytics. Thank you, AppWars Technology and Priyanshu Pal Sir, for providing such an excellent learning experience!Posted on Google
 Aryan TomarPriyanshu pal is the best IT member And he is very such good person and her behaviour is very nice 👍🏼🙂 The learning environment was very supportive, and she patiently cleared all my doubts throughout the course. Overall, it was a wonderful learning experience, and I would highly recommend AppWars Technologies to anyone who wants to learn AWS and cloud computing from the basics. ❤️6Posted on Google
 PRIYANSH SHARMAExcellent Ha BhaiyaPosted on Google
 Harsh VermaPriyanshu pal sir excellent explain to all students 👍👍Posted on Google
 Vikram KumarSir is good teach and skill for studentsVerified by TrustindexTrustindex verified badge is the Universal Symbol of Trust. Only the greatest companies can get the verified badge who has a review score above 4.5, based on customer reviews over the past 12 months. Read more

Talk to our experts and choose the right course and career path for your future.