
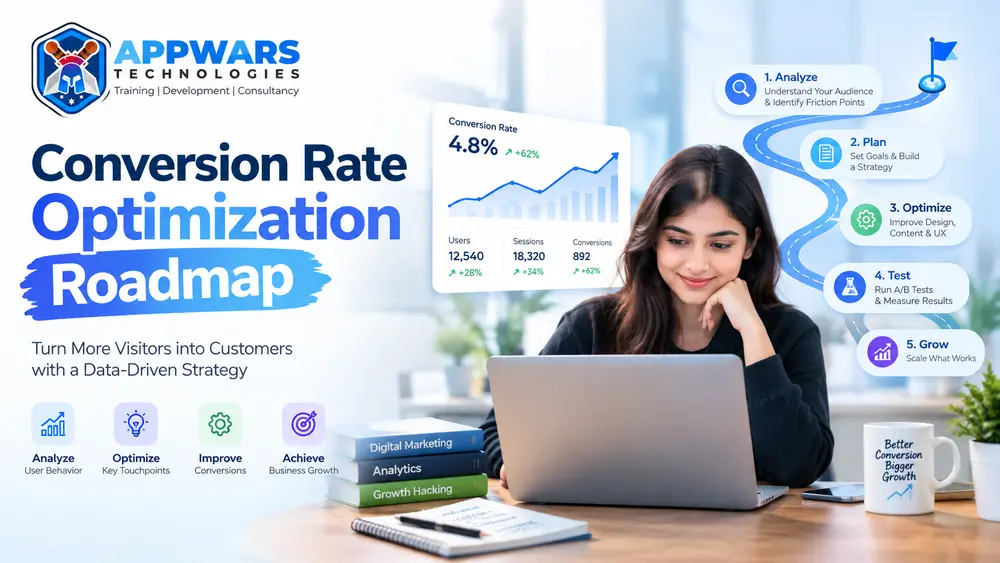
You pay for the clicks. Visitors land on your page. Then most of them leave without filling the form, buying the course or booking the demo.
I see this in almost every batch I teach. Students learn to drive traffic through SEO, Google Ads and Meta Ads, and then find out that traffic alone doesn’t pay anyone’s salary. The skill that closes the gap is conversion rate optimization (CRO), and the quickest way to learn it is a conversion rate optimization roadmap with a clear order of work.
This conversion rate optimization roadmap has 6 stages, from your first tracking setup to advanced experimentation. Students planning a digital marketing career and working professionals who own a landing page can both follow it. You’ll find formulas, tools, tables and a 12-week plan below.
What is conversion rate optimization?
Conversion rate optimization is the practice of raising the percentage of visitors who complete a goal on your website or app. The goal can be a purchase, a signup, a lead form, a course enquiry or a brochure download. Each completed goal is a conversion.
The formula is short:
Conversion rate (%) = (Conversions ÷ Total visitors) × 100Say 2,000 people visit your course page and 40 send an enquiry. Your conversion rate is 2%. Lift it to 3% and the same traffic brings 60 enquiries. That’s a 50% jump without spending another rupee on ads.
Two terms show up in every CRO conversation:
- Macro conversion: the main business goal, such as a purchase or a paid enrolment.
- Micro conversion: a smaller step on the way, such as a video play, an add-to-cart click or a newsletter signup.
Why you need a conversion rate optimization roadmap
Random changes give random results. Someone swaps a button colour, sees no change and decides CRO doesn’t work. A conversion rate optimization roadmap fixes the order: measure first, research second, form a hypothesis, fix the obvious problems, then test.
The money argument is easy to see. These numbers are illustrative, but the maths is real.
| Metric | Before CRO | After CRO |
|---|---|---|
| Ad spend | ₹100,000 | ₹100,000 |
| Clicks | 5,000 | 5,000 |
| Conversion rate | 2% | 3% |
| Leads | 100 | 150 |
| Cost per lead | ₹1,000 | ₹667 |
One more point. Google hasn’t confirmed conversion rate as a ranking factor. But the fixes CRO produces (faster pages, clearer content, easier navigation) usually help organic visitors too. If you’re still building the traffic side, read our SEO roadmap alongside this conversion rate optimization roadmap.
The conversion rate optimization roadmap at a glance
Here is the full conversion rate optimization roadmap in one table.
| Stage | Timeline | Main focus | What you finish with |
|---|---|---|---|
| 1. Foundations | Weeks 1 to 2 | Goals, tracking, baseline metrics | Working GA4 setup and a baseline report |
| 2. Research | Weeks 3 to 4 | Funnel data, heatmaps, surveys | A list of friction points |
| 3. Hypotheses | Week 5 | Writing and ranking test ideas | A scored backlog |
| 4. Page fixes | Weeks 6 to 8 | Landing page and UX basics | Cleaner, faster, clearer pages |
| 5. A/B testing | Weeks 9 to 12 | Controlled experiments | Your first 2 to 3 tested results |
| 6. Advanced | Month 4 onwards | Segmentation, personalisation, programme building | A repeatable experimentation system |
Stage 1: Build the foundations (weeks 1 to 2)
Every conversion rate optimization roadmap starts with measurement. You can’t improve a number you don’t measure.
- Pick one primary goal per page. A course landing page exists to get enquiries. A product page exists to get add-to-cart clicks. Two goals on one page split attention.
- Install Google Analytics 4 and Google Tag Manager. Track form submissions, phone-number clicks, WhatsApp clicks and purchases as events.
- Mark your key events in GA4. These become your conversion counts in every report.
- Record a 90-day baseline. Pull conversion rate by device, traffic source and landing page. Without it you can’t prove an improvement later.
- Map your funnel. Awareness, visit, engagement, lead, customer. Write down the drop-off at each step.
Here are the metrics you’ll keep returning to as you work through the conversion rate optimization roadmap.
| Metric | What it tells you | Where to find it |
|---|---|---|
| Conversion rate | Share of visitors who complete the goal | GA4 key events |
| Engagement rate | Share the sessions that were actually engaged. | GA4 reports |
| Click-through rate | Whether your ad or snippet earns the visit | Google Ads, Search Console |
| Cost per acquisition | What each conversion costs you | Ad platforms, GA4 |
| Average order value | Revenue per transaction | GA4 monetisation reports |
| Cart abandonment rate | Where buyers quit the checkout | GA4 funnel exploration |
| Form completion rate | How many people who start a form finish it | Tag Manager events |
If you want the wider skill map before going deeper, the digital marketing roadmap shows where this conversion rate optimization roadmap fits.
Stage 2: Research your visitors (weeks 3 to 4).
Stage 2 of the conversion rate optimization roadmap is about finding out why people leave. Quantitative data tells you what happens. Qualitative data tells you why. You need both.
| Method | The question it answers | Tool to use |
|---|---|---|
| Funnel analysis | Which step loses the most people? | GA4 Explorations |
| Heatmaps | Where do visitors click and scroll? | Microsoft Clarity, Hotjar |
| Session recordings | What confuses or blocks them? | Microsoft Clarity |
| On-page surveys | What stopped them from converting? | Hotjar, Google Forms |
| Customer calls and chats | Which words do real buyers use? | Your CRM, call recordings |
| Speed and Core Web Vitals | Is the page slow on mobile? | PageSpeed Insights |
Pay attention to the Core Web Vitals thresholds Google publishes on web.dev: Largest Contentful Paint under 2.5 seconds, Interaction to Next Paint under 200 milliseconds, and Cumulative Layout Shift under 0.1. A slow mobile page kills conversions before design even matters.
When I audit student projects, 3 problems come up first: a slow mobile page, a form that asks for too much, and a headline that talks about the company instead of the visitor. Check for those before anything fancy.
A quick CRO audit checklist
- Does the headline tell a visitor what they get within 5 seconds?
- Is there one clear call to action above the fold?
- Does the page load in under 3 seconds on a mid-range phone?
- Can someone find fees, timing or price without hunting?
- Do forms ask only for what you need to follow up?
- Is there proof (reviews, results, certificates, real photos) near the button?
Stage 3: Turn findings into hypotheses and rank them (week 5)
This step of the conversion rate optimization roadmap turns research into test ideas. A hypothesis links evidence to a change and a result. Use this template:
Because we saw [data or observation],
we believe that [change] will cause [outcome],
which we'll measure with [metric].
Example: “Because 61% of mobile visitors drop off at the 7-field form, we believe cutting it to 4 fields will raise form completions, measured by form completion rate.”
You’ll end up with 20 or 30 ideas. Rank them with the ICE method: score each idea from 1 to 10 for Impact, Confidence and Ease, then average the three.
| Test idea | Impact | Confidence | Ease | ICE score |
|---|---|---|---|---|
| Cut the enquiry form from 7 fields to 4. | 8 | 8 | 9 | 8.3 |
| Add student testimonials above the fold. | 6 | 7 | 9 | 7.3 |
| Redesign the entire homepage. | 9 | 4 | 2 | 5.0 |
| Change the button colour | 2 | 3 | 10 | 5.0 |
The form change wins. The full redesign sounds exciting and scores low on confidence and ease. That’s the point of scoring.
Stage 4: Fix the page fundamentals (weeks 6 to 8)
This part of the conversion rate optimization roadmap covers problems that don’t need a test. A broken mobile layout or a missing call to action should simply be repaired. Landing page optimization at this stage covers the basics.
| Page element | Common problem | Fix |
|---|---|---|
| Headline | Vague or company-focused | State the outcome for the visitor in plain words. |
| Call to action | Several competing buttons | One primary action, repeated at logical points |
| Form | Too many fields | Ask for the minimum; add inline error messages. |
| Social proof | Hidden at the bottom | Place reviews and results next to the button. |
| Mobile layout | Tiny tap targets, slow load | Test on a real phone, compress images. |
| Trust signals | Missing address and policy links | Show contact details, certifications, and refund terms. |
| Checkout | Forced account creation | Offer guest checkout and a clear cost breakdown. |
Good copy and good layout share a root: clear thinking about the visitor. If design is your weak spot, the UI/UX designer roadmap covers the layout principles behind these fixes. For ad traffic, make sure the landing page repeats the promise in the ad. The comparison in Google Ads or Facebook Ads helps you decide which channel to send to which page.
Stage 5: Run A/B tests the right way (weeks 9 to 12)
Testing sits at the centre of the conversion rate optimization roadmap. An A/B test shows version A to half your visitors and version B to the other half, then compares results. It’s the most reliable way to prove a change works.
Follow these rules:
- Test one change at a time. Otherwise you can’t tell which change caused the result.
- Choose the primary metric before launch. Switching metrics afterwards is how people fool themselves.
- Calculate sample size first. A rough rule of thumb for 80% power and 95% confidence: n per variant ≈ 16 × p(1 − p) ÷ δ², where p is your baseline rate and δ is the absolute lift you want to detect.
- Run for at least 2 full weeks. Weekdays and weekends behave differently.
- Don’t peek and stop early. Early swings are noise.
- Write every result down, including the losers.
Here’s the formula in action. The baseline is 3%, and you want to detect a lift to 3.6%, so δ is 0.006. That gives 16 × 0.03 × 0.97 ÷ 0.006², about 12,900 visitors per variant. A page with 1,000 visitors a month can’t test small changes, so it should make bolder ones.
Google’s free testing tool was shut down in September 2023, so teams now use tools such as VWO or Convert or run tests through their own development stack. Expect many tests to lose or tie. That’s normal, and each result tells you something about your visitors.
Want practice without risking a live site? The A/B test analysis idea in our data analytics projects list is a good portfolio piece, and the Data Analytics Course in Noida teaches the statistics behind it.
Stage 6: Advanced conversion rate optimization (month 4 onward)
Once you have tested basics, you move from running tests to running a programme. This is where a conversion rate optimization roadmap separates professionals from hobbyists.
| Level | What you work on | Example |
|---|---|---|
| Segmentation | Different results for different groups | Mobile visitors from Meta Ads behave unlike desktop visitors from search |
| Personalisation | Content that matches the visitor | Show a Delhi-based visitor the Noida batch dates |
| Multivariate testing | Several elements at once | Headline and image combinations, with enough traffic |
| Server-side testing | Tests that run before the page loads | Pricing tests and flicker-free layouts |
| Full-funnel testing | Changes beyond the page | Email follow-up timing, onboarding steps |
| Statistical methods | Faster, cleaner decisions | Bayesian analysis, sequential testing, variance reduction |
A few practices mark an advanced conversion rate optimization roadmap:
- Keep a backlog and a knowledge base. Every test, result and lesson goes in a shared sheet. After a year it becomes your most useful asset.
- Track test velocity. Teams that run more tests per quarter learn faster.
- Look past the first conversion. Measure revenue per visitor, lead quality and retention. A form that doubles junk leads isn’t a win.
- Use AI as an assistant. It can cluster hundreds of survey comments or draft headline variants quickly, and you still judge what to test. Our list of AI tools for digital marketing covers options.
- Connect CRO to paid and organic work. The SEO vs Google Ads comparison shows how each channel feeds the same landing pages.
Essential tools for your conversion rate optimization roadmap
| Purpose | Tool | Cost note |
|---|---|---|
| Web analytics | Google Analytics 4 | Free |
| Tag management | Google Tag Manager | Free |
| Heatmaps and recordings | Microsoft Clarity, Hotjar | Clarity is free; check Hotjar’s current plans |
| A/B testing | VWO, Convert | Paid; trials available |
| Page speed | PageSpeed Insights | Free |
| Reporting | Looker Studio | Free |
| Surveys | Google Forms, Typeform | Free tiers available |
More options are in our guide to the best digital marketing tools.
Skills you need for the conversion rate optimization roadmap
| Skill | Where you use it | How to build it |
|---|---|---|
| Web analytics | Baselines, funnels, reporting | Practise in GA4 on a real site |
| Copywriting | Headlines, buttons, forms | Rewrite 1 landing page a week |
| UX basics | Layout, mobile experience | Study the UI/UX roadmap above |
| Basic statistics | Sample size, significance | Take a data analytics course |
| SQL and spreadsheets | Pulling and cleaning data | Our SQL training in Noida |
| Paid media | Matching ads to pages | Google Ads course and Meta Ads course |
If you prefer guided learning with live projects while you work through the conversion rate optimization roadmap, the Digital Marketing Course in Noida and the SEO Course in Noida both cover analytics and landing page work. You can also build a portfolio from digital marketing projects and show real before-and-after numbers to employers.
Common mistakes when following a conversion rate optimization roadmap
Avoid these 7 mistakes and your conversion rate optimization roadmap stays on track.
- Copying a competitor’s page. Their traffic, offer and audience differ from yours.
- Testing before fixing. Repair obvious problems first.
- Stopping a test when it looks good. Wait for the planned sample.
- Testing tiny changes on low traffic. You’ll wait months for an answer.
- Ignoring mobile. In India most visits come from phones, so design for the small screen first.
- Tracking only the final sale. Micro conversions show where people stall.
- Skipping documentation. You’ll repeat old tests and forget old lessons.
Frequently asked questions
What is a conversion rate optimization roadmap?
A conversion rate optimization roadmap is a step-by-step plan that orders your CRO work: tracking, research, hypotheses, page fixes, A/B tests and advanced experiments. It keeps a team from testing random ideas.
What is a good conversion rate?
It varies by industry, traffic source and offer. Many e-commerce sites see roughly 2% to 3%, while lead-generation pages can run higher or lower. Compare yourself with your own baseline first.
How long does it take to learn CRO?
Following this conversion rate optimization roadmap, most beginners handle the basics in 12 weeks with steady practice. Advanced experimentation takes 6 to 12 months of real tests.
Do I need coding skills for CRO?
Coding isn’t needed at the start. Analytics, copywriting and UX basics come first. HTML, CSS and JavaScript help you build test variants later, and SQL helps with data.
What is the difference between CRO and SEO?
SEO brings visitors to your site. CRO turns those visitors into leads or customers. They work best together.
How many visitors do I need for A/B testing?
It depends on your baseline rate and the lift you want to detect. In the conversion rate optimization roadmap example above, a 3% baseline needs about 12,900 visitors per variant to detect a lift to 3.6%.
Can students build a CRO career?
Yes. Companies hire CRO analysts, growth marketers and experimentation specialists. A portfolio built through this conversion rate optimization roadmap, with documented tests, carries real weight.
Your next step
Pick one landing page this week and start the conversion rate optimization roadmap on it. Set up tracking, record the baseline and run the audit checklist. That single page will teach you more than any article, this one included.
A conversion rate optimization roadmap works because it removes guesswork. Measure, research, rank, fix, test, repeat. If you want mentors and live projects while you learn, visit Appwars Technologies at C-20, 1st Floor, Sector 2, Noida, or explore the course pages linked above.