
Power BI holds over 60% of the BI market share in mid-sized and enterprise companies in India in 2026. Recruiters use that exact number when they scope a data analyst req, so if you’re picking a first BI tool, this is where the jobs already are.
If you’re a student choosing a starting point or a working professional stuck doing manual Excel reports every Monday, this Power BI roadmap gives you the exact sequence to follow. From your first pivot table to a certified, portfolio-backed dashboard job.
I’ll break this Power BI learning path into 11 stages, tell you how long each one realistically takes, and flag where most people get stuck.
Who This Roadmap is For
This works whether you’re starting from zero or switching tracks mid-career.
- Students and freshers with a BCA, B.Tech, MBA, or commerce background who want a data role without a 2-year science degree first.
- Excel-heavy professionals in finance, operations, or sales MIS who already build reports manually and want to automate the grind.
- Working with analysts on other BI tools (Tableau, QlikView) adding Power BI because it’s what most Indian job postings ask for now.
- Career switchers from non-technical roles who need a credible, certification-backed path into analytics without going back to full-time college.
If you fall into any of these groups, the stages below apply in the same order. Only the pace changes.
Why Power BI is Still the Smart Choice in 2026
3 things changed the calculus for anyone building a Power BI roadmap this year.
First, Microsoft folded Power BI into Fabric. Your semantic models now connect to OneLake and DirectLake mode, so what you build in Power BI can plug straight into a company’s broader data platform instead of sitting in a silo.
Second, the salary numbers back the demand. Power BI developers in India earn an average of ₹9 lakh a year, with senior specialists at ₹18-22 lakh. Entry-level analysts with Power BI on their resume start around ₹4-6 lakh, and that climbs fast once you add SQL and DAX.
Third, the PL-300 certification (Microsoft’s official Power BI Data Analyst credential) carries an 18-30% salary premium over non-certified candidates. That’s hiring data, not a course marketing claim.
None of this works if you learn Power BI the wrong way: watching tutorials without touching real data, memorizing DAX syntax without understanding filter context, or skipping certification because “the tool is easy to pick up.” It is easy to pick up. Getting hired on it takes a plan, and that’s what this roadmap gives you.
The Complete Power BI Roadmap: Stage by Stage
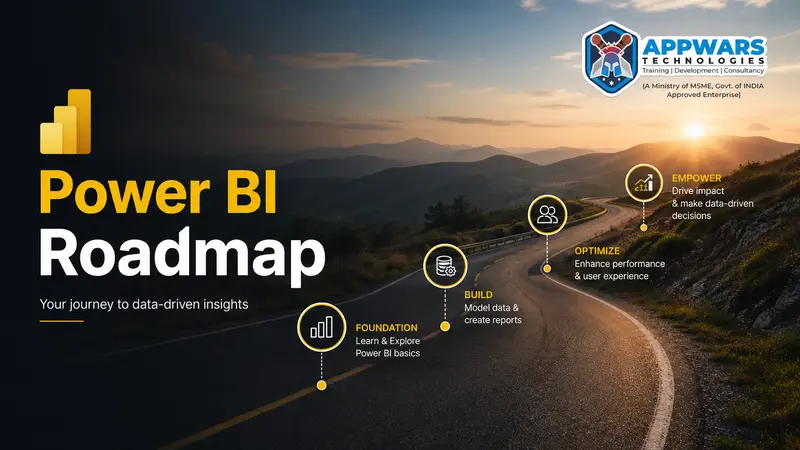
Here’s the full Power BI learning roadmap, mapped to realistic timelines if you’re studying 8-10 hours a week.
| Stage | What you build | Time needed | Core skill |
|---|---|---|---|
| 1. Data foundations | Pivot tables, formulas | 2 weeks | Excel logic, data types |
| 2. Power BI Desktop | First connected report | 1 week | Interface, data sources |
| 3. Power Query | Cleaned, shaped datasets | 2 weeks | M language, transformations |
| 4. Data modeling | Star schema model | 2-3 weeks | Relationships, cardinality |
| 5. DAX | Working measures | 3-4 weeks | CALCULATE, filter context |
| 6. Visualization | Interactive dashboards | 2 weeks | Charts, bookmarks, drill-through |
| 7. Power BI Service | Published, shared reports | 1 week | Workspaces, scheduled refresh |
| 8. Security and governance | Role-secured datasets | 1 week | Row-level security |
| 9. Microsoft Fabric basics | Lakehouse-connected model | 2 weeks | DirectLake, OneLake, |
| 10. PL-300 certification | Passed exam | 3-6 weeks | Exam objectives, practice tests |
| 11. Portfolio projects | 3-4 case studies | Ongoing | End-to-end BI projects |
That’s roughly 4 to 6 months from zero to job-ready. Faster if you already know Excel and SQL.
Stage 1-2: Build the Foundation Before you Open Power BI
Skip this and you’ll fight the tool for months. Power BI runs on the same logic as Excel pivot tables and Power Pivot: rows, columns, aggregations, and relationships. If you can already build a pivot table and write a VLOOKUP or XLOOKUP, you’re most of the way there.
Once you install Power BI Desktop (free, no license needed at this stage), connect it to a real dataset. Not the sample “Adventure Works” file every tutorial uses. Pull data from a CSV of your own bank statements, your gym’s attendance sheet, or anything with actual mess in it. Clean data teaches you nothing about the tool.
Stage 3: Power Query is Where Most Beginners Quit Too Early
Power Query is Power BI’s data cleaning engine, and it runs on a language called M. Most learners treat this stage as a speed bump before “the real work” of DAX and visuals. That’s a mistake. Analysts at every level report spending more time cleaning data than analyzing it.
Focus on:
- Removing duplicates and handling nulls without deleting rows blindly
- Splitting and merging columns
- Unpivoting wide tables into long format (you’ll use this constantly)
- Query folding, so transformations push back to the source instead of loading everything into memory
2 weeks here is enough to get functional. You’ll keep sharpening this skill for years.
Stage 4: Data Modeling Decides Whether Your DAX will Work
A star schema, 1 central fact table surrounded by lookup dimension tables, is the backbone of every Power BI model that performs well. Jam everything into one flat table instead, and your DAX measures will break in ways that look random but aren’t.
Learn the difference between a fact table and a dimension table. Learn why bidirectional relationships cause more problems than they solve. Get comfortable with cardinality (one-to-many, many-to-many) before you touch a single DAX formula.
Stage 5: DAX is the Real Rest
This is the stage that separates people who can drag fields onto a canvas from people who get hired. DAX (Data Analysis Expressions) takes 6-8 weeks to learn properly, and the CALCULATE function alone eats up 2-3 weeks for most learners because it forces you to think in filter context, not row context.
Prioritize, in this order:
- Basic measures: SUM, AVERAGE, COUNT
- CALCULATE and FILTER
- Time intelligence: TOTALYTD, SAMEPERIODLASTYEAR, DATEADD
- Iterators: SUMX, AVERAGEX
- Table functions: ALL, VALUES, RELATED
If you can write a working year-over-year growth measure and explain why it works, you’re through the hardest part of this Power BI roadmap.
Stages 6-8: visuals, publishing, and access control
Building a report is the fun part, and also the part that gets overrated. A dashboard with 15 visuals crammed onto one page isn’t impressive; it’s unreadable. Stick to 8-10 visuals per page, use bookmarks for guided navigation, and add drill-through pages so users can go from summary to detail without cluttering the main view.
Once the report works, publish it to the Power BI service. This is where you’ll set up workspaces, configure gateways for on-premises data, schedule refreshes, and, this matters for any real job, implement row-level security so a regional sales manager only sees their own region’s numbers.
Stage 9: don’t skip Microsoft Fabric
Power BI isn’t a standalone product anymore. It’s 1 workload inside Microsoft Fabric, alongside Lakehouses, Data Factory pipelines, and Synapse-style engineering tools. You don’t need to become a data engineer, but you do need to understand DirectLake mode and OneLake, because that’s how modern Power BI semantic models connect to enterprise data without duplicating it.
Recruiters in 2026 increasingly expect at least surface familiarity with Fabric, even for pure analyst roles. Skip this stage, and your resume reads like it’s stuck in 2022.
Here’s a concrete way to think about it. Before Fabric, a Power BI model was often a copy of company data sitting in your own file, refreshed on a schedule. With DirectLake mode, your report reads straight from OneLake storage, so there’s no separate import step and no stale copy sitting between you and the source. You don’t need to build a Lakehouse yourself to get hired, but you should be able to explain that difference in an interview.
Stage 10: Get Certified on Microsoft’s Power BI roadmap
Microsoft updates its own Microsoft Power BI roadmap for certification every year, and 2026 carries a January refresh to the PL-300 exam objectives. 3 certifications touch Power BI directly:
- PL-300 (Power BI Data Analyst Associate): the one you want first. Tests data prep, modeling, visualization, and governance.
- DP-600 (Fabric Analytics Engineer Associate): for people moving toward Lakehouses and enterprise-scale Fabric work.
- PL-900 (Power Platform Fundamentals): an awareness-level exam, useful mainly if you’re brand new to the wider Power Platform.
PL-300 costs $165, stays valid for 12 months, and renews through a free online assessment with no re-exam. The exam covers 4 domains: preparing data (25-30%), modeling data (25-30%), visualizing and analyzing (25-30%), and managing and securing Power BI (15-20%). Budget 3-6 weeks of focused prep once you’ve worked through stages 1-9.
Stage 11: your portfolio matters more than your certificate
A certification gets you past the automated resume filter. A portfolio gets you the interview. Build 3-4 end-to-end dashboards using messy, real-world data such as retail sales, hospital wait times, or e-commerce churn. For each one, document the business question you were answering, not just the chart you built.
Put these on GitHub or a simple portfolio site with screenshots and a short write-up. Recruiters skim. Make the business impact visible in the first line.
Power BI career paths and salary in India, 2026
| Role | Experience | Typical salary (India) |
|---|---|---|
| Power BI / reporting analyst | 0-2 years | ₹4-6 lakh |
| Power BI developer | 2-5 years | ₹6-11 lakh |
| Senior BI consultant | 5-9 years | ₹11-18 lakh |
| BI manager / analytics lead | 10+ years | ₹18-22 lakh+ |
Bengaluru, Pune, Hyderabad, and Gurugram pay 15-25% above these averages, driven by IT and BFSI hiring density. Professionals who pair Power BI with SQL and automation skills earn up to 35% more than Power BI generalists, so don’t stop at the visualization layer.
Where this fits with data science and data analytics
Power BI is rarely the whole job. Most analyst and developer roles expect SQL for querying source systems, Excel for quick ad hoc work, and increasingly, some Python for automation. If you want the fuller picture of how BI connects to statistical modeling and machine learning, our Data Science Certification covers Python, ML, and AI on top of the visualization layer.
If your goal is specifically the analyst track (SQL, Power BI, Tableau, and business reporting, without the machine learning side), a structured data analytics training program gets you there faster than piecing together free tutorials on your own.
And if Power BI itself is the gap in your resume, start with a dedicated Power BI course that walks through DAX, data modeling, and real dashboard projects with an instructor who can catch the mistakes tutorials won’t.
Mistakes that stall this roadmap
- Learning DAX before data modeling. You’ll write formulas that work by accident and break the moment your data changes shape.
- Only practicing on sample datasets. Adventure Works doesn’t have the duplicate customer IDs and inconsistent date formats you’ll face on the job.
- Treating the PL-300 as optional. It’s not required everywhere, but it’s the fastest way past automated screening, especially without a referral.
- Skipping Power BI Service and governance. Building reports in Desktop and never publishing, securing, or scheduling them means you’ve learned half the job.
- No portfolio. A certificate with zero visible project work reads as theoretical, not job-ready.
Frequently asked Questions For Power BI Roadmap
Is Power BI hard to learn?
The interface isn’t hard. Dragging fields onto a report canvas takes days, not weeks. DAX and data modeling are where the real learning curve sits, and that’s the part this Power BI roadmap weights most heavily, at 5-7 weeks combined.
Do I need to know coding for Power BI?
No traditional programming is required to start. Power Query uses the M language, and DAX has its own syntax, but neither is general-purpose coding like Python or Java. If you’re comfortable with Excel formulas, you can pick up both.
Is PL-300 worth it for freshers?
Yes, more so for freshers than for experienced hires. Without a work history to point to, a certification is often the only proof a recruiter has that you can actually build a working data model, not just watch tutorials about one.
How is Power BI different from Excel?
Excel is built for row-by-row, sheet-by-sheet work with data that fits in memory. Power BI is built for millions of rows, live connections to enterprise data sources, and shared, governed reports that update on a schedule instead of a manual save. Excel skills transfer directly, but the two tools solve different problems.
Should I learn Power BI or Tableau first in India?
Power BI, for job volume. It has a wider employer base across Indian mid-market and enterprise companies because of Microsoft’s existing footprint in those organizations. Tableau still commands strong salaries in premium consulting and global MNC roles, so it’s worth adding later if that’s the direction you want.
How long this actually takes
If you’re consistent, 8-10 hours a week of project-based practice rather than passive video watching, 4-6 months takes you from zero to a certified, portfolio-backed Power BI profile. Working professionals with existing Excel and SQL exposure often move through stages 1-4 in half that time.
Start with the data, not the dashboard. Everything else on this Power BI roadmap gets easier once you can look at a messy spreadsheet and already see the star schema hiding inside it.