
Picture this. You just got handed a messy CSV with 40,000 rows of sales data, and your manager wants a summary by Friday. Do you open Excel or Google Sheets? For most people, that decision happens on autopilot, whatever they used in college or their last job. But if you actually care about speed, accuracy, and not losing your mind halfway through a pivot table, the choice matters more than you’d think.
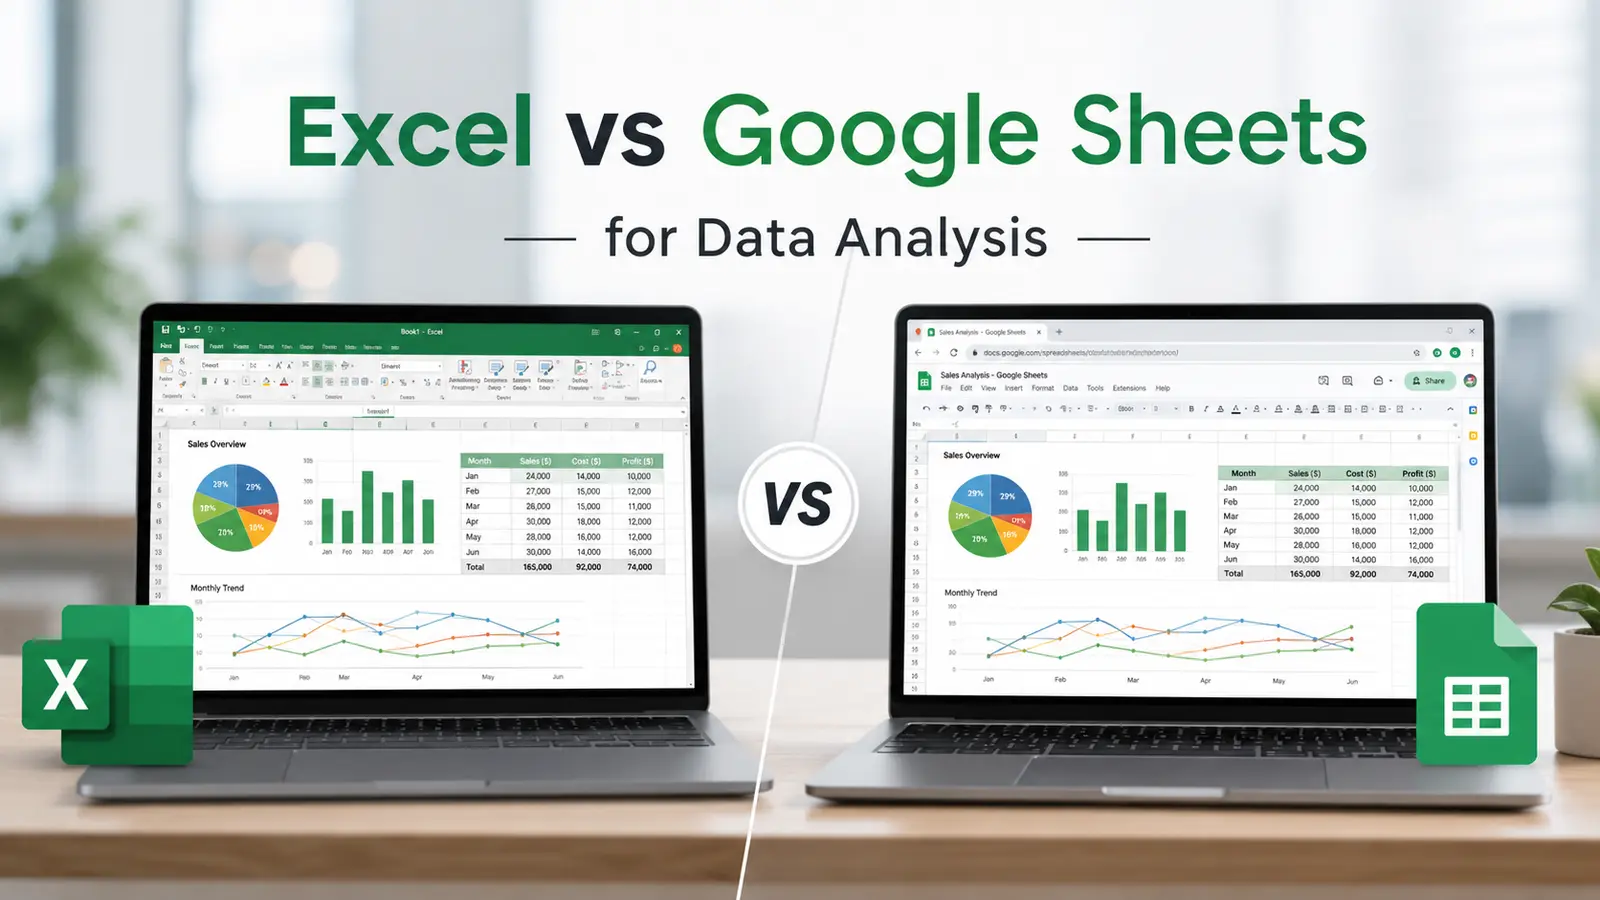
Excel and Google Sheets both do spreadsheets. That’s where the similarity mostly ends. One was built for desktop power, the other for the cloud. This article breaks down excel vs google sheets for data analysis across features, performance, collaboration, pricing, and automation, so you can pick the right tool instead of just the familiar one.
What is data analysis in spreadsheet software?
Data analysis in a spreadsheet means taking raw numbers and turning them into something a human can act on. You import data, clean it up (removing duplicates, fixing typos, standardizing formats), then run calculations, build charts, and spot patterns.
A spreadsheet is basically a lightweight database with a calculator strapped to it. You don’t need to write SQL or Python to ask “which region sold the most last quarter.” You just build a formula or drop the data into a pivot table. That accessibility is exactly why Excel and Google Sheets remain the first tools most analysts reach for, long before anyone touches a BI platform.
What is Microsoft Excel?
Excel has been around since 1985, and it shows, in a good way. It’s the desktop-first spreadsheet tool built by Microsoft, and it’s been refined for four decades around one job: crunching numbers fast and deep.
Its strengths are hard to overstate. Excel handles massive datasets without choking. It has advanced formula functions, PivotTables that can slice millions of rows in seconds, and tools like Power Query and Power Pivot that basically turn it into a mini data warehouse. Financial analysts, accountants, and anyone doing heavy modeling tend to live in Excel because nothing else on the market matches its formula depth.
Common use cases: financial models, budget forecasting, statistical analysis, inventory tracking, and any report where formatting and precision need to be pixel-perfect.
If you’re planning to build a career in data analytics, finance, or business intelligence, learning Excel beyond the basics can give you a strong advantage. A structured Excel Training program helps you master PivotTables, Power Query, advanced formulas, dashboards, and real-world data analysis techniques.
What is Google Sheets?
Google Sheets showed up in 2006 as part of Google Workspace, and its entire design philosophy is different. It’s cloud-native. That single fact shapes everything else about it.
Because it lives in the browser, multiple people can edit the same sheet at the same time and see each other’s cursors moving. No emailing files back and forth, no “final_v3_ACTUAL_final.xlsx” nonsense. It ties directly into Gmail, Google Forms, Google Data Studio, and Google Drive, so pulling in survey responses or sharing a live dashboard takes minutes, not hours.
Common use cases: team reporting, marketing dashboards, small business bookkeeping, quick data pulls from forms, and any project where five people need eyes on the same file at once.
Excel vs Google Sheets for data analysis: feature-by-feature comparison
| Feature | Excel | Google Sheets |
| Ease of use | Steeper learning curve, deeper toolset | Simpler interface, faster to learn |
| Performance with large datasets | Handles millions of rows well | Slows down past roughly 1-2 million cells |
| Collaboration | Improved via OneDrive, but not native | Real-time, built from the ground up |
| Charts and visualization | More chart types, finer formatting control | Solid basics, easier to share live |
| Pivot tables | Extremely powerful, highly customizable | Functional, but fewer advanced options |
| Formulas and functions | 400+ functions, deep nesting support | Strong function library, some Excel-only formulas missing |
| Power Query | Yes, built in | Not available |
| Power Pivot | Yes, built in | Not available |
| Automation | VBA macros, very mature | Google Apps Script, flexible and modern |
| AI features | Copilot integration (paid tiers) | Gemini integration, built into free tier |
| Add-ons and integrations | Large third-party ecosystem | Massive Google Workspace integration |
| Offline access | Full offline functionality | Offline mode available, more limited |
| Security | Enterprise-grade, IT-managed | Google account security, strong but different model |
| Pricing | One-time purchase or Microsoft 365 subscription | Free with Google account, paid tiers for business |
| File compatibility | Native .xlsx, opens most formats | Converts Excel files, occasional formatting shifts |
Neither tool wins across the board. Excel dominates on raw computational power. Google Sheets dominates on collaboration and accessibility. The right pick depends on what you’re actually doing with the data.
Excel for data analysis
Excel earns its reputation when the data gets big or the math gets complicated. If you’re working with a dataset that has hundreds of thousands of rows, Excel simply processes it faster and more reliably.
Advanced formulas are where Excel really separates itself. Functions like INDEX-MATCH, array formulas, and nested IF statements let analysts build calculations that would take Google Sheets noticeably longer to compute, or that Sheets can’t replicate at all. PivotTables in Excel support calculated fields, custom grouping, and drill-through options that go well beyond what Sheets offers.
Then there’s Power Query and Power Pivot, arguably Excel’s biggest advantage for serious data work. Power Query lets you connect to dozens of data sources, clean and reshape data through a repeatable pipeline, and refresh it with one click. Power Pivot handles relational data models with millions of rows, something that would crash a typical spreadsheet. Combine those two, and Excel starts behaving like a lightweight version of Power BI.
For financial modeling, business intelligence work, and professional reporting where formatting needs to be exact (think board decks or investor reports), Excel is still the default choice for most finance teams.
Google Sheets for data analysis
Google Sheets earns its keep in a completely different scenario: when speed of collaboration matters more than raw processing power.
Real-time collaboration is the headline feature. Two, five, or twenty people can be in the same sheet simultaneously, commenting, editing, and tagging each other, with version history tracking every change automatically. For teams spread across time zones, this alone can save hours a week.
Because it’s cloud-based, you can open your data from any device with a browser. No syncing files, no “I left it on my work laptop” problem. It plugs directly into Google Forms for survey data, Google Data Studio (Looker Studio) for dashboards, and Google Apps Script for custom automation, all without leaving the Google ecosystem.
Sheets handles small and medium datasets comfortably, and honestly, that covers most day-to-day business reporting. Marketing teams building a weekly performance dashboard, small businesses tracking expenses, or analysts pulling quick reports for a stakeholder meeting all benefit more from Sheets’ shareability than from Excel’s raw horsepower.
Excel vs Google Sheets: pros and cons
| Pros | Cons | |
| Excel | Handles huge datasets, deep formula library, Power Query and Power Pivot, precise formatting, mature automation via VBA | Costs money, weaker native collaboration, heavier software, steeper learning curve |
| Google Sheets | Free to start, real-time collaboration, cloud access from anywhere, tight Workspace integration, simpler for beginners | Slower on large datasets, fewer advanced statistical functions, less formatting control, depends on internet connection |
Which tool is better for different users?
Beginners and students usually get up to speed faster in Google Sheets. The interface is less cluttered, and there’s no software to install, you just open a browser tab. That said, if you’re a student aiming for a career in finance or analytics, learning Excel early pays off, since most employers still expect it.
Freelancers tend to prefer Google Sheets for client work. Sharing a live link beats emailing an attachment every time you make an update. Data analysts and business analysts, on the other hand, usually need Excel’s depth, particularly Power Query and PivotTables, once datasets grow past a few thousand rows.
Finance professionals lean almost exclusively on Excel. Financial modeling, scenario analysis, and audit trails are built around Excel conventions that the industry has standardized on for decades. Marketing teams and small businesses, by contrast, often do fine in Sheets, where dashboards update automatically from connected data sources and multiple team members need edit access.
Large enterprises typically run both: Excel for heavy financial and analytical work, Sheets for cross-team reporting and quick collaboration. Remote teams, given the nature of distributed work, tend to favor Sheets purely for the real-time editing.
Performance comparison
With large datasets, Excel is faster and more stable. Once a Google Sheet crosses roughly a million or two cells, lag becomes noticeable, formulas recalculate slower, and the browser can start to strain. Excel, running natively on your machine, doesn’t hit that ceiling nearly as fast.
Speed-wise, Excel processes complex formulas and large pivot operations quicker, especially with Power Pivot’s in-memory engine. Sheets is fast enough for typical business use, but ask it to recalculate 500,000 rows of nested formulas and you’ll feel the difference.
Automation is close, just built differently. VBA in Excel is decades-old and battle-tested, with an enormous library of existing scripts and community support. Google Apps Script, built on JavaScript, is arguably more modern and easier to learn if you already know some coding, and it integrates cleanly with other Google services.
Visualization is roughly a wash for basic charts, though Excel offers finer control over formatting for polished, print-ready reports. Sheets makes it easier to embed a live chart into a shared dashboard that updates automatically.
Scalability ultimately favors Excel for pure data volume, and Google Sheets for scaling a team’s ability to work on the same file without version chaos.
Common mistakes when choosing between Excel and Google Sheets
A lot of people pick based on habit rather than need. If your team has always used Excel, switching to Sheets “because it’s free” without checking whether your formulas and macros will translate can cause real headaches, some Excel functions simply don’t exist in Sheets.
Another common mistake: underestimating dataset size. Someone builds a Google Sheet for what starts as a 5,000-row project, and six months later it’s 300,000 rows and crawling. At that point, migrating to Excel (or a real database) mid-project is more painful than starting there.
People also overlook collaboration needs until it’s too late. Building a complex Excel workbook for a five-person team, then discovering everyone needs simultaneous access, forces an awkward pivot to Sheets after the structure is already set.
And a subtler one: assuming file compatibility is perfect. Converting between .xlsx and Sheets format can shift formatting, break certain formulas, or change how conditional formatting renders. Always test a sample file before committing a whole project to one platform.
Best practices for data analysis
Keep raw data separate from your working calculations. A dedicated “raw data” tab that never gets touched manually saves you from the classic disaster of accidentally overwriting a source cell.
Use named ranges and consistent formatting for anything you’ll reuse, in either Excel or Sheets. It makes formulas more readable and cuts down on errors when you’re referencing the same range across multiple sheets.
Validate your data before you analyze it. Data validation rules (dropdowns, restricted inputs, duplicate checks) catch messy entries before they skew your results. This matters more in Sheets, where multiple people editing at once increases the chance of accidental typos.
When building dashboards, separate the calculation layer from the display layer. Do the heavy formula work on a hidden or secondary tab, then reference clean, summarized values on your dashboard tab. It keeps things fast and easy to audit.
Finally, document your formulas. A comment explaining why a formula exists, not just what it does, saves whoever inherits the file (including future you) a lot of guesswork.
Conclusion
Excel and Google Sheets solve the same basic problem in different ways. Excel gives you raw power: bigger datasets, deeper formulas, Power Query, Power Pivot, and formatting control that holds up in professional reports. Google Sheets gives you speed of collaboration: real-time editing, cloud access from any device, and tight integration with the rest of Google Workspace.
If you’re a data analyst working with large datasets, building financial models, or need advanced pivot and query tools, Excel is the stronger choice. If you’re managing team reporting, working with a distributed team, or just need something fast, free, and shareable, Google Sheets fits better.
For most people the real answer is: learn both. Use Excel when the data gets heavy and the math gets serious. Use Sheets when the team needs to move fast together. Plenty of analysts do exactly that, switching tools based on the task instead of loyalty to one platform.
Frequently asked questions
1. Which is better, Excel or Google Sheets?
Neither wins outright. Excel is better for large datasets, advanced formulas, and financial modeling. Google Sheets is better for real-time collaboration, cloud access, and simpler day-to-day reporting.
2. Can Google Sheets handle large datasets?
It can, up to a point. Performance starts to drag once you’re past roughly 1-2 million cells or heavy nested formulas. For truly large-scale analysis, Excel or a dedicated database tool handles it better.
3. Which is better for beginners?
Google Sheets, generally. The interface is simpler, there’s nothing to install, and free tutorials are everywhere. Excel has a steeper learning curve but offers more room to grow into advanced analysis.
4. Is Excel worth learning in 2026?
Yes. Most finance, accounting, and analyst roles still list Excel as a core requirement, and its formula depth and Power Query/Power Pivot tools remain unmatched by Sheets for heavy analytical work.
5. Which spreadsheet is better for business reporting?
It depends on the report. For polished, formatted, print-ready reports, Excel usually wins. For live dashboards shared across a team, Google Sheets is faster to set up and easier to keep updated.
6. Can Google Sheets replace Excel?
For most small business and team reporting needs, yes. For heavy financial modeling, massive datasets, or advanced statistical work, not yet. Many teams end up using both rather than picking one.
7. Do Excel skills transfer to Google Sheets?
Mostly. Core formulas like SUM, VLOOKUP, and IF work in both. But Excel-specific tools like Power Query, Power Pivot, and certain array formulas don’t have direct equivalents in Sheets.
8. Is Google Sheets free forever?
Yes, with a personal Google account, Sheets is free with generous storage limits. Business features like advanced admin controls and increased storage come through paid Google Workspace plans.