
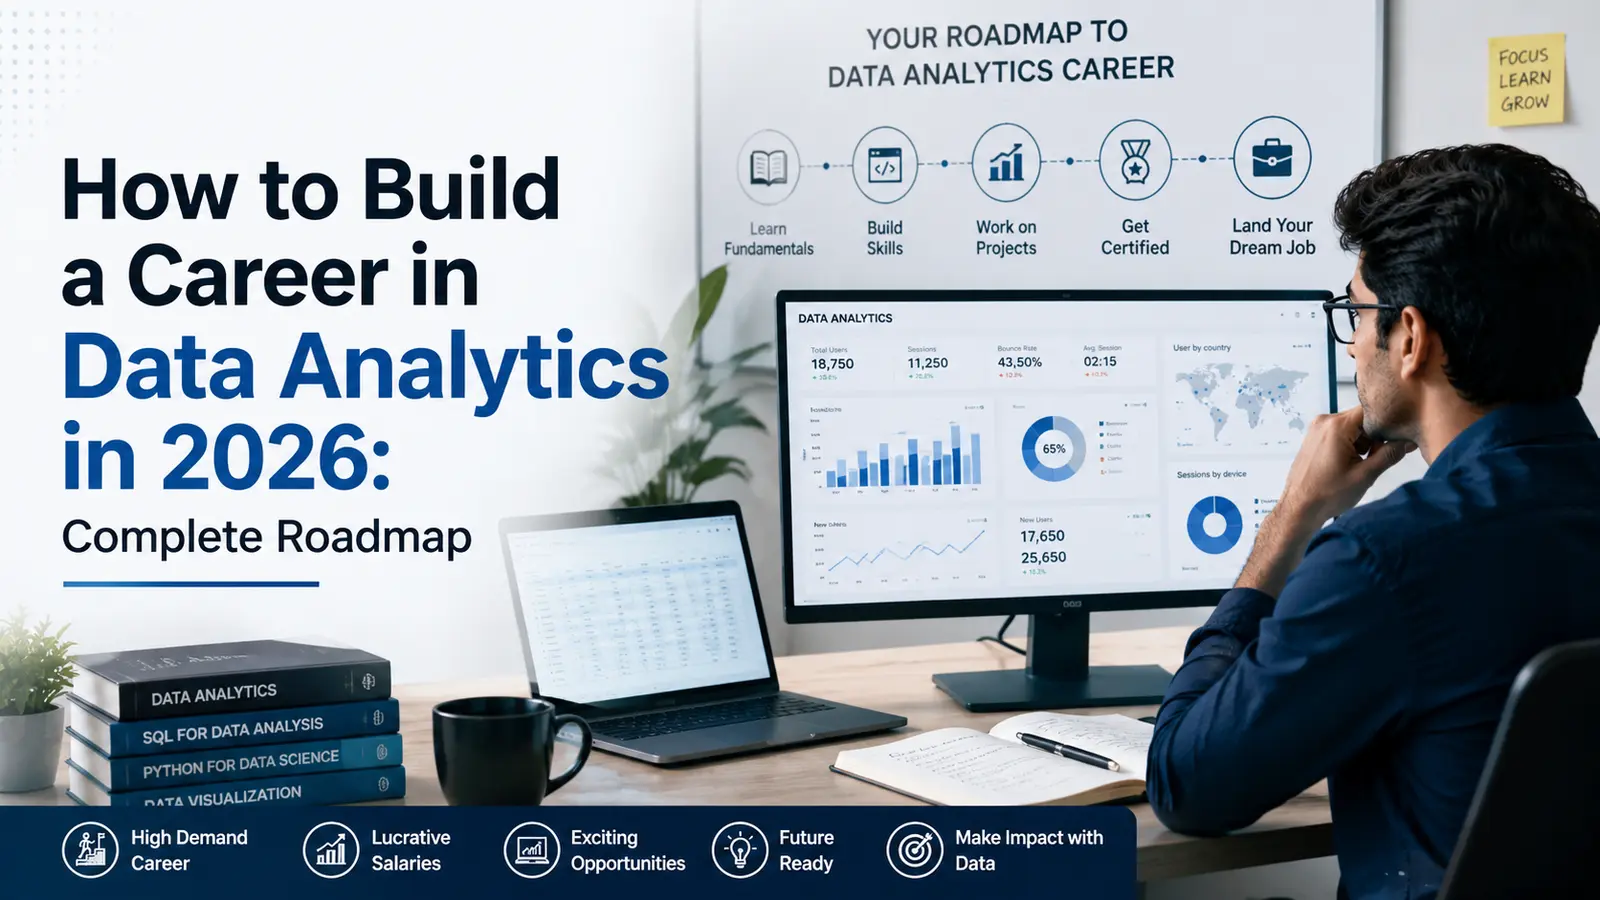
Every company you’ve ever bought something from is now staring at a dashboard, trying to figure out why you bought it. That’s the job. A career in Data Analytics has gone from “nice technical skill” to the thing entire business strategies hang on, and 2026 is shaping up to be one of the best years to walk through that door.
I’ve watched this field grow from “the Excel person on the marketing team” to a standalone profession with its own hiring pipelines, salary bands, and certification industry. If you’re wondering how to become a Data Analyst without drowning in conflicting advice from 50 YouTube videos, this roadmap covers the whole thing: what the work actually is, which data analyst technical skills required to get hired, the exact order to learn them in, and what you can realistically expect to earn once you do.
What is Data Analytics?
Data Analytics is the process of examining raw data to find patterns, answer questions, and support decisions. That’s it at its core. A retailer wants to know why sales dipped in March. An analyst pulls the numbers, finds that a competitor ran a promotion the same week, and tells the team what happened and why.
Businesses use data analytics because guessing is expensive. A company that tracks customer behavior, inventory turnover, or campaign performance can react in weeks instead of months. Multiply that across thousands of companies and you get the hiring demand we’re seeing right now.
There are four types of Data Analytics, and you’ll use all of them on the job:
Descriptive analytics answers “what happened.” Monthly sales reports. Website traffic summaries. The bread and butter of entry-level work.
Diagnostic analytics answers “why it happened.” If sales dropped, diagnostic analytics digs into the cause: pricing, seasonality, a broken checkout page.
Predictive analytics answers “what’s likely to happen next.” This leans on statistics and basic machine learning to forecast demand, churn, or revenue.
Prescriptive analytics answers “what should we do about it.” This is the most advanced layer, often blending into data science territory.
People mix up Data Analytics vs Data Science vs Business Analytics constantly, so here’s the short version. Data Analytics interprets existing data to solve specific business questions. Data Science builds predictive models and often involves heavier coding, algorithms, and sometimes deploying machine learning systems into production. Business Analytics sits closer to strategy, translating data insights into business decisions, often with less hands-on coding. The lines blur in real job postings, but that’s the general split.
Why choose Career in Data Analytics in 2026?
Demand isn’t slowing down. Industry estimates point to India creating well over 10 million data and analytics jobs by 2026, and that’s just one country. E-commerce, banking, healthcare, manufacturing, logistics: pick an industry, and someone there is hiring an analyst right now.
The pay backs this up. Data analytics career opportunities in 2026 span everything from startups paying modestly for fresh talent to MNCs offering serious packages for analysts who can pair technical skill with business sense.
AI hasn’t replaced analysts. It’s raised the bar for what they’re expected to deliver. Tools now handle the grunt work of cleaning and basic reporting, which means companies expect analysts to spend more time on interpretation and strategy, less on manual spreadsheet wrangling. That’s good news if you’re building real skills instead of just memorizing formulas.
Remote and hybrid roles are common in this field since most of the work happens on a laptop with cloud-based tools. And career growth is genuinely long-term: a junior analyst today can move into senior analyst, analytics manager, data scientist, or even product roles within a few years, provided they keep building.
Skills required to become a Data Analyst in 2026
Technical skills
Here’s what shows up in almost every job posting for this role.
Microsoft Excel is still the first thing hiring managers check: pivot tables, VLOOKUP/XLOOKUP, conditional formatting, basic dashboards. Not glamorous, but you’ll use it constantly. SQL is non-negotiable since every company stores data in databases, and SQL is how you talk to them: joins, aggregations, subqueries, window functions. Python is the most common programming language for analytics work, mainly for the libraries built around it; you don’t need to become a software engineer, just comfortable manipulating data and running basic statistical tests.
Statistics is the part beginners skip and regret skipping. Averages, standard deviation, probability, correlation, hypothesis testing: this is what separates someone who reports numbers from someone who understands what the numbers mean. Power BI and Tableau are the two dashboarding tools companies actually pay for; learn one deeply, get familiar with the other. Data cleaning sounds boring until you realize most analysts spend 60-70% of their time on it, since messy data is the default state of the world. Data visualization is about communicating findings clearly, not just making charts look pretty. And basic machine learning concepts like regression and clustering won’t make you a data scientist, but understanding them helps you collaborate with teams that build predictive models.
Soft skills
The technical stack gets you in the door. Soft skills get you promoted.
Analytical thinking is the ability to break a vague question (“why are users leaving?”) into something you can actually measure.
Problem solving matters because most real business problems don’t come with a clean dataset attached. You’ll have to figure out what to even look at.
Communication skills decide whether your insight gets used or ignored. A brilliant analysis that nobody understands is a wasted afternoon.
Business understanding is underrated. Knowing how the company makes money changes what you flag as important.
Critical thinking keeps you from reporting a correlation as if it were a cause, which is a mistake that ends careers faster than any Excel error.
Step-by-step Data Analytics career roadmap in 2026
This is the order I’d recommend, and the order most successful self-taught analysts I’ve come across actually followed.
Step 1: Learn Microsoft Excel
Start here even if it feels basic. Formulas, pivot tables, charts, and simple dashboards build the muscle memory you’ll lean on for years. Most beginners underestimate how much daily analyst work still runs through Excel.
Step 2: Master SQL
Once Excel feels comfortable, move to SQL. Database management, queries, joins, aggregation, filtering: spend real time here. This is the single skill that shows up in nearly every technical interview for this field.
Step 3: Learn statistics
This is where a lot of beginners get impatient and skip ahead to flashy tools. Don’t. Probability, averages, distributions, hypothesis testing, and correlation give you the judgment to know whether a result actually means something or is just noise.
Step 4: Learn Python
With statistics in place, Python clicks faster. Focus on:
NumPy for numerical operations, Pandas for data manipulation (you’ll live in this library), Matplotlib for basic visualization, and Scikit-learn at a beginner level so you understand how models work even if you’re not building them daily.
Step 5: Learn data visualization tools
Power BI and Tableau turn your analysis into something a non-technical manager can glance at and understand in 10 seconds. Pick one to go deep on based on what’s more common in your target industry, and get comfortable enough in the other to not be lost in an interview.
Step 6: Work on real-world projects
Stop watching tutorials and start building. Pull a public dataset and ask your own question of it. This is where the actual learning happens, not in the courses.
Step 7: Build a portfolio
Upload your projects to GitHub. Write a short explanation of the problem, your approach, and what you found. A portfolio with 3-4 solid projects beats a resume listing 15 tools you’ve barely touched.
Step 8: Learn Git and GitHub
Version control isn’t optional anymore, even for analysts. It’s how teams collaborate on code and track changes, and interviewers notice when you know your way around it.
Step 9: Prepare for interviews
Practice SQL queries on a whiteboard or shared screen. Be ready to walk through a Python script. Brush up on Excel functions you haven’t touched in a while. Most importantly, prepare for case study questions where you’re handed a vague business problem and asked to think out loud.
Step 10: Apply for internships and jobs
Polish your resume around outcomes, not tool lists (“reduced reporting time by 30% using Power BI dashboards” beats “proficient in Power BI”). Clean up your LinkedIn. Then apply, consistently, not just to the five companies you’ve heard of.
Essential tools every Data Analyst should learn
Beyond what’s covered in the roadmap, keep these on your radar: Microsoft Excel, SQL, Python, Power BI, Tableau, Google Sheets (lighter, collaborative version of Excel that many smaller teams prefer), Jupyter Notebook (where most of your Python analysis will actually happen), Git, and GitHub.
You don’t need to master all nine before applying anywhere. You need working knowledge of most of them and real depth in two or three.
Best Data Analytics projects for beginners
Recruiters have seen the same five Kaggle projects a thousand times. Pick something that lets you ask a question you actually care about, then execute it well. A few solid starting points: a sales performance dashboard tracking revenue and top products, an HR analytics dashboard analyzing attrition, a customer churn analysis using basic classification, a Netflix data analysis by genre or release year, an e-commerce sales dashboard built around seasonal buying patterns, a retail sales comparison across stores, an IPL data analysis (genuinely fun, clean public datasets), or a COVID-19 dashboard tracking case trends over time.
Pick two or three. Do them properly. Document your thinking, not just your code.
Certifications that can boost your career
Certifications won’t replace a portfolio, but paired with real projects, they add credibility, especially for beginners with no prior work experience. The Google Data Analytics Professional Certificate is widely recognized and covers the fundamentals well. Microsoft Certified: Power BI Data Analyst Associate is worth it if you’re leaning into the Microsoft ecosystem. The IBM Data Analyst Professional Certificate covers SQL and Python with decent hands-on practice. Microsoft Learn has free modules that are genuinely useful and often overlooked. AWS Data Analytics certifications are optional but help for roles touching cloud infrastructure.
Don’t collect certificates like trophies. Pick one or two relevant to your target role and finish them.
Career opportunities after learning Data Analytics
The Data Analyst Career Path branches in more directions than people expect. Once you’ve built the core skill set, these roles all become realistic targets: Data Analyst, Business Analyst (more strategy-focused), Business Intelligence Analyst (dashboards and reporting at scale), Reporting Analyst, Product Analyst (measuring feature adoption inside product teams), Marketing Analyst (campaign performance, segmentation), Financial Analyst (budgeting and forecasting), and Operations Analyst (logistics and process optimization).
This range is exactly why Data Science and Analytics Career paths feel so flexible. The core skills transfer across industries and job titles in a way few other career tracks manage.
Data Analyst salary in India in 2026
Numbers vary by source, city, and company type, but here’s a realistic picture based on current market data.
Freshers typically land between ₹3.5 LPA and ₹6 LPA, with strong portfolios and SQL/Python skills pushing that toward ₹7-8 LPA at product companies, especially in Bangalore, Hyderabad, or Delhi NCR. Mid-level professionals with 2-5 years of experience generally earn between ₹8 LPA and ₹14 LPA, with stronger jumps for analysts who’ve picked up BI tools or domain specialization in finance or e-commerce. Senior Data Analysts with 5+ years typically earn ₹15 LPA to ₹25 LPA, and at MNCs or top product companies that can stretch to ₹30 LPA or higher, especially for those who’ve moved into leadership tracks like Analytics Manager.
The city matters too. Bangalore consistently pays the highest across all experience levels, with Hyderabad, Mumbai, and Delhi NCR close behind.
Common mistakes beginners should avoid
I’ve seen the same handful of mistakes derail people over and over. Skipping SQL because Python feels more exciting (don’t, since most interviews lean heavily on SQL). Ignoring statistics because it feels theoretical (it isn’t; it’s the difference between understanding your data and just reading numbers off a screen). Learning too many tools at once instead of going deep on a few. Not building projects, since courses give you exposure but projects give you proof. Not creating a portfolio, because if a recruiter can’t see your work in five minutes, they move to the next resume. And not practicing interview questions: knowing SQL and writing a query live under pressure are two different skills, so practice the second one specifically.
How to choose the right Data Analytics course
If you’re going the structured course route instead of (or alongside) self-teaching, here’s what actually matters when comparing options. Updated curriculum matters because tools and best practices shift fast in this field. Industry-expert trainers who’ve actually worked as analysts bring context no textbook can. Hands-on projects built into the course, not bolted on as an afterthought, separate a useful course from a glorified video playlist.
Internship opportunities give you something real to put on a resume before your first job. Placement assistance and active career support matter more than people expect, especially for career switchers without an existing network in tech. Certification on completion adds a small but real credibility boost, particularly for fresh graduates.
A good Data Analytics Training covers most of these areas. A great one makes you build something real before it hands you a certificate.
Frequently asked questions
1. Is Data Analytics a good career choice in 2026?
Yes. Demand keeps climbing across industries, salaries are growing year over year, and the skill set transfers across roles like Business Analyst, BI Analyst, and Product Analyst. It’s one of the more stable entry points into the broader tech and business world right now.
2. What skills are required to become a Data Analyst?
Core technical skills include Excel, SQL, Python, statistics, and at least one visualization tool like Power BI or Tableau. On the soft skills side, analytical thinking, communication, and business understanding matter just as much as the technical stack.
3. Can I become a Data Analyst without coding?
Partially. You can start in Excel and BI-tool-heavy roles with minimal coding, but most mid-level and senior positions expect at least working SQL knowledge, and increasingly some Python. Avoiding code entirely will limit how far you can grow in this field.
4. Is Python necessary for Data Analytics?
It’s close to essential at this point. While some entry-level roles get by on Excel and SQL alone, Python opens up far more job opportunities and is expected for any role touching automation, deeper statistical analysis, or basic predictive work.
5. Should I learn SQL before Python?
Yes. SQL is more directly tied to how data is stored and retrieved, and it’s usually the first technical skill tested in interviews. Learning it first also makes Python’s data manipulation libraries click faster, since the concepts overlap.
6. How long does it take to become a Data Analyst?
With consistent effort, most people can build job-ready skills in 6 to 12 months, covering Excel, SQL, statistics, Python basics, a visualization tool, and a small portfolio of projects. Faster is possible if you’re coming from a related technical background.
7. Which is better for beginners: Power BI or Tableau?
Power BI tends to be easier to pick up for beginners, especially if you’re already comfortable in the Microsoft ecosystem, and it’s in heavy demand across Indian companies. Tableau has a steeper learning curve but is valued strongly in certain industries and global companies. Either is a fine starting point; just commit to one first.
8. What projects should beginners build for Data Analytics?
Start with something you can finish end-to-end: a sales dashboard, a customer churn analysis, or an analysis of a dataset tied to something you’re personally interested in, like sports or streaming data. Two or three well-documented projects beat ten rushed ones.
9. What is the average salary of a Data Analyst in India in 2026?
Freshers generally start between ₹3.5 LPA and ₹6 LPA, mid-level professionals earn ₹8 LPA to ₹14 LPA, and senior analysts typically land between ₹15 LPA and ₹25 LPA, with higher figures at top product companies and MNCs.
10. Which Data Analytics course is best for beginners?
There’s no single best answer here since it depends on your learning style and budget, but look for updated curriculum, real hands-on projects, experienced trainers, and some form of placement or career support. Compare two or three options against those criteria before committing.
Conclusion
This Data Analytics Career Roadmap isn’t complicated, but it does take consistency. Excel, SQL, statistics, Python, visualization tools, projects, a portfolio, and interview prep, in roughly that order. Skip steps and you’ll feel it in interviews. Follow them and build real projects along the way, and you’ll be in a strong position by the time you’re job hunting.
The Data Analytics Scope in 2026 looks solid: high demand, real salary growth, and a career path that bends toward whatever interests you, whether that’s product, finance, marketing, or straight technical analytics. Start with Excel today. Worry about machine learning later.
Also read- Top Data Analytics Skills